In today’s fast-paced and highly competitive business landscape, having access to real-time, accurate sales data is no longer optional, it’s a necessity. Odoo 19 addresses this need with enhanced sales reporting capabilities in its Sales module, delivering powerful and customizable tools that enable businesses to monitor performance, analyze customer behavior, forecast demand, and support strategic planning. With interactive dashboards, real-time KPIs, and advanced filtering and grouping options, organizations can transform raw data into actionable insights, optimize sales operations, and drive sustainable growth. The Sales Reporting feature in Odoo also provides a structured and comprehensive view of key sales metrics across daily, weekly, monthly, and yearly periods, empowering teams to make smarter, data-driven decisions that improve efficiency and productivity. In this blog, we’ll explore these reporting features in detail and explain how they can make a meaningful impact on your sales business.
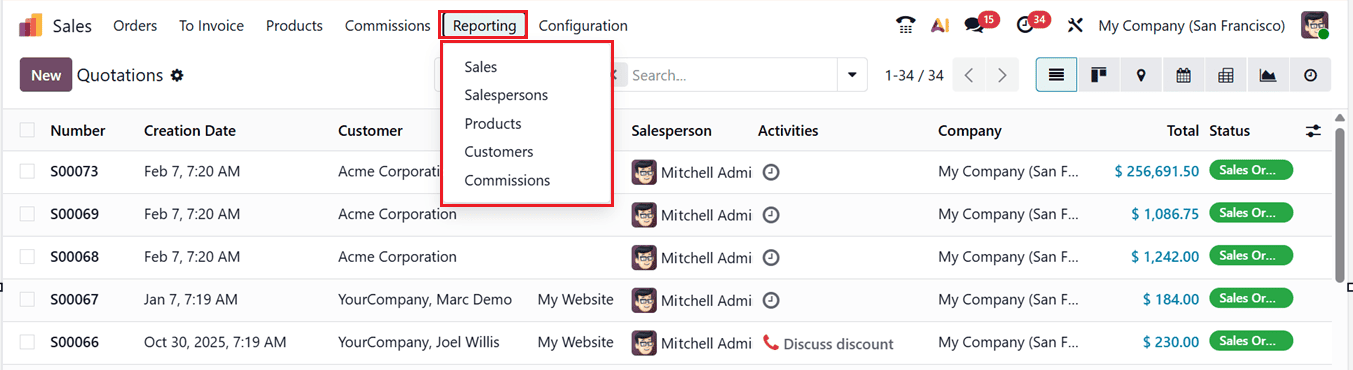
Inside the ‘Reporting’ menu of the Odoo 19 Sales Module, you can get an analysis of Sales, Salespersons, Products, Customers and Commissions,as shown in the screenshot below.
1. Sales
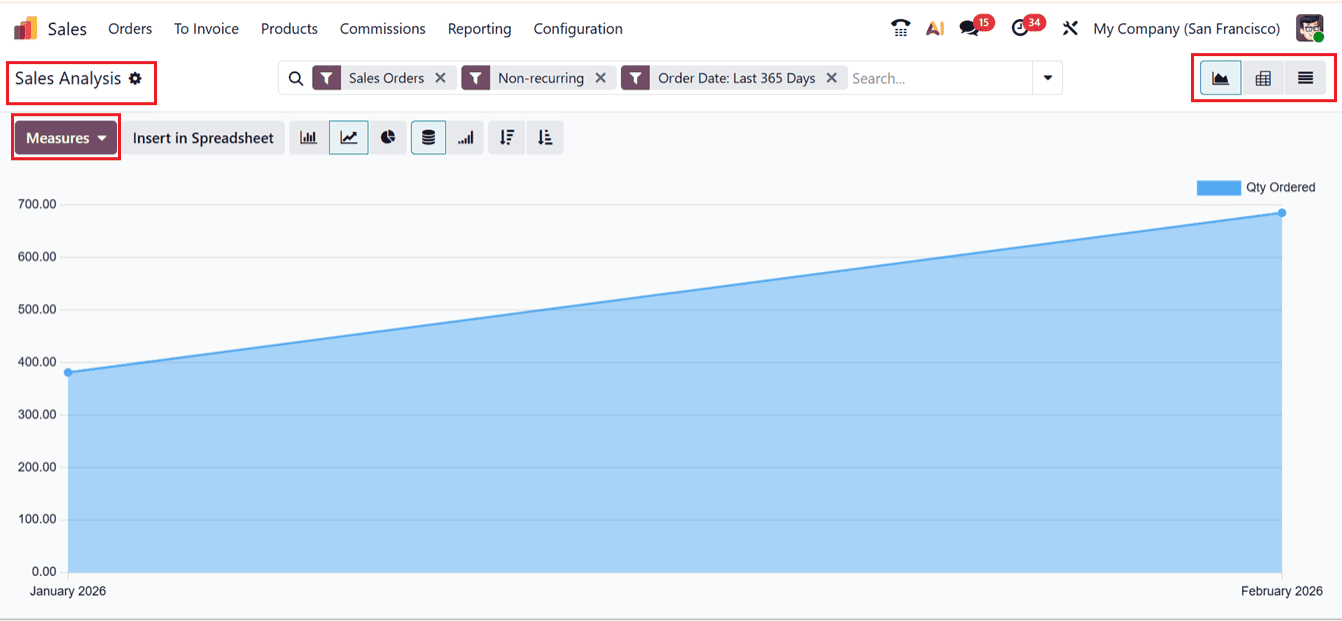
The ‘Sales’ Analysis Reporting in the Odoo 19 Sales module offers a simple yet powerful way to evaluate sales performance, allowing businesses to analyze data across products, customers, sales teams, time periods, and revenue metrics from a centralized, user-friendly interface.
This view is easy to adjust and lets users change display formats using icons in the top-right corner.Odoo provides both Graphical, Pivot and List views to present data effectively, as shown in the screenshot below.
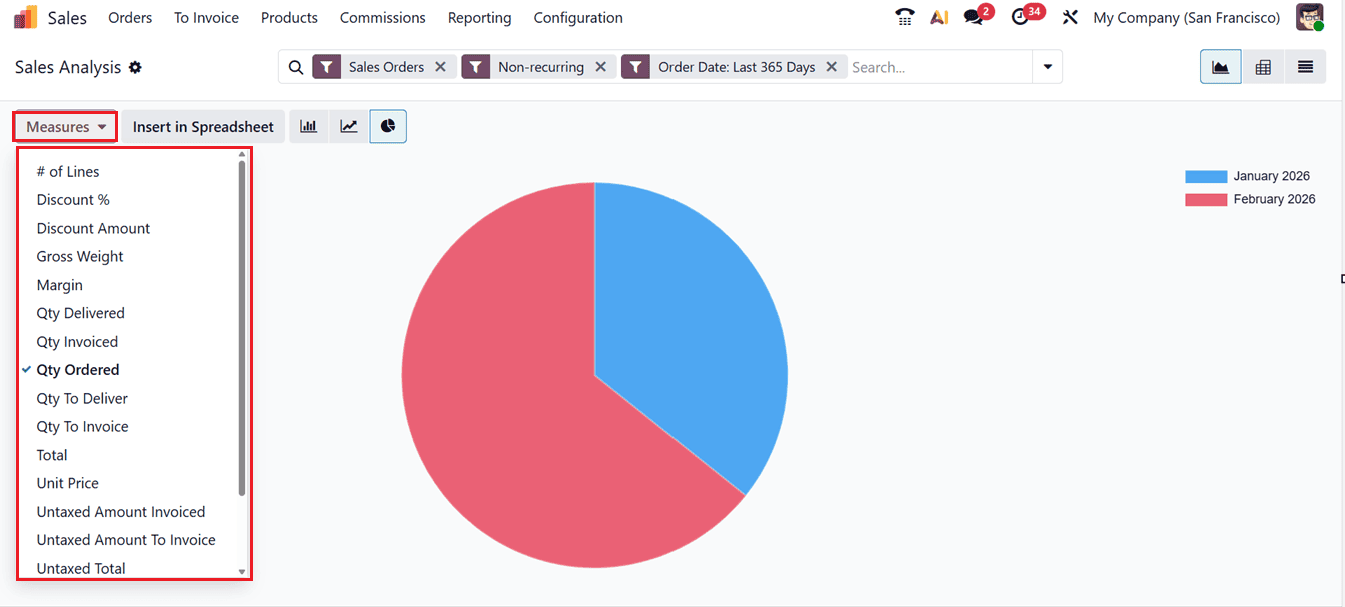
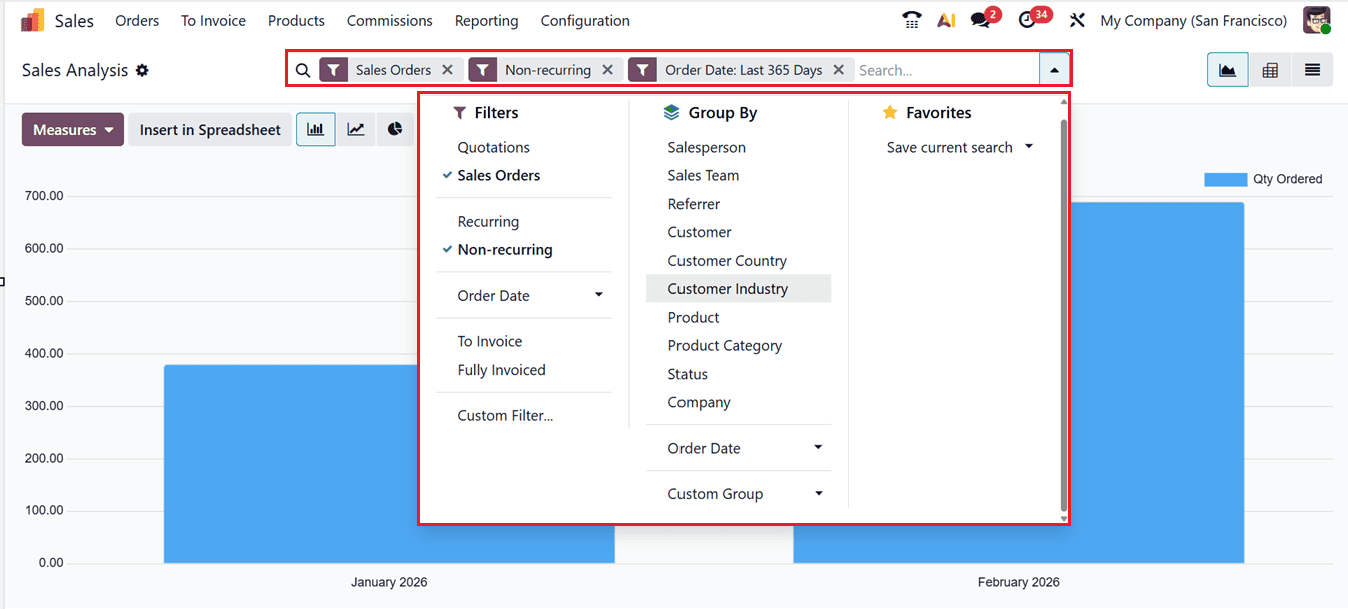
In the Sales Analysis view, the Measures option lets you choose and review key sales data such as ; Discount, Discount Amount, Gross Weight, Margin, Qty Delivered, Qty Invoiced, Qty Ordered, Qty To Deliver, Qty To Invoice, Total, Unit Price, Untaxed Amount Invoiced, Untaxed Amount To Invoice, Untaxed Total etc, as shown below.
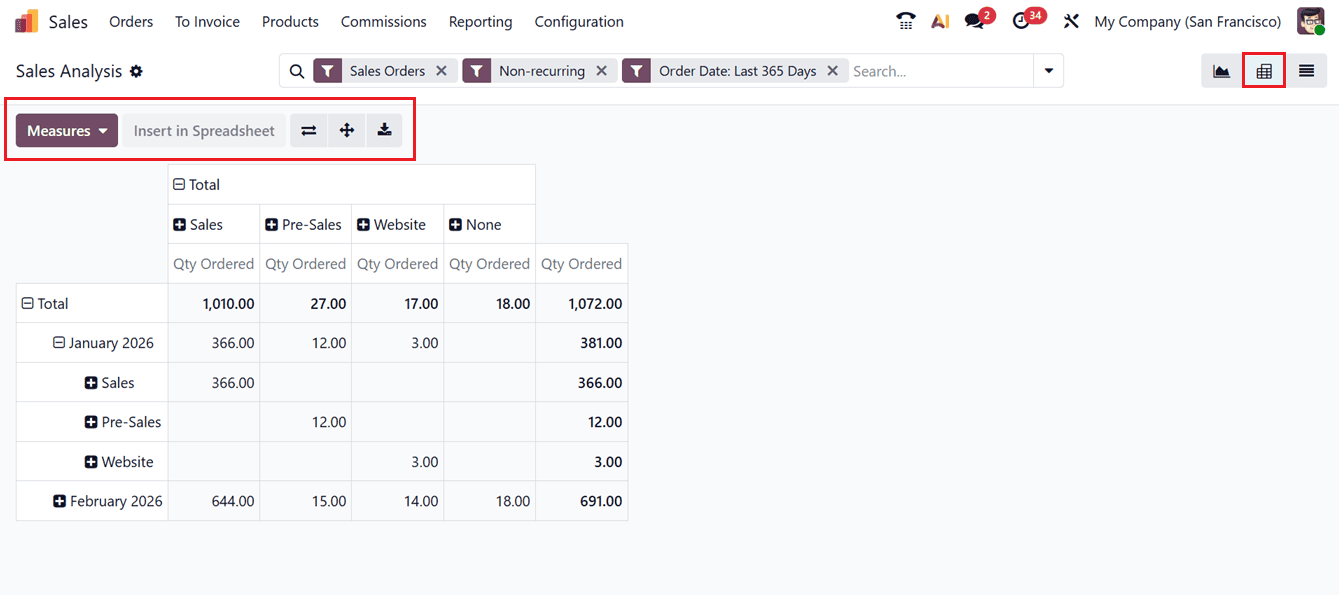
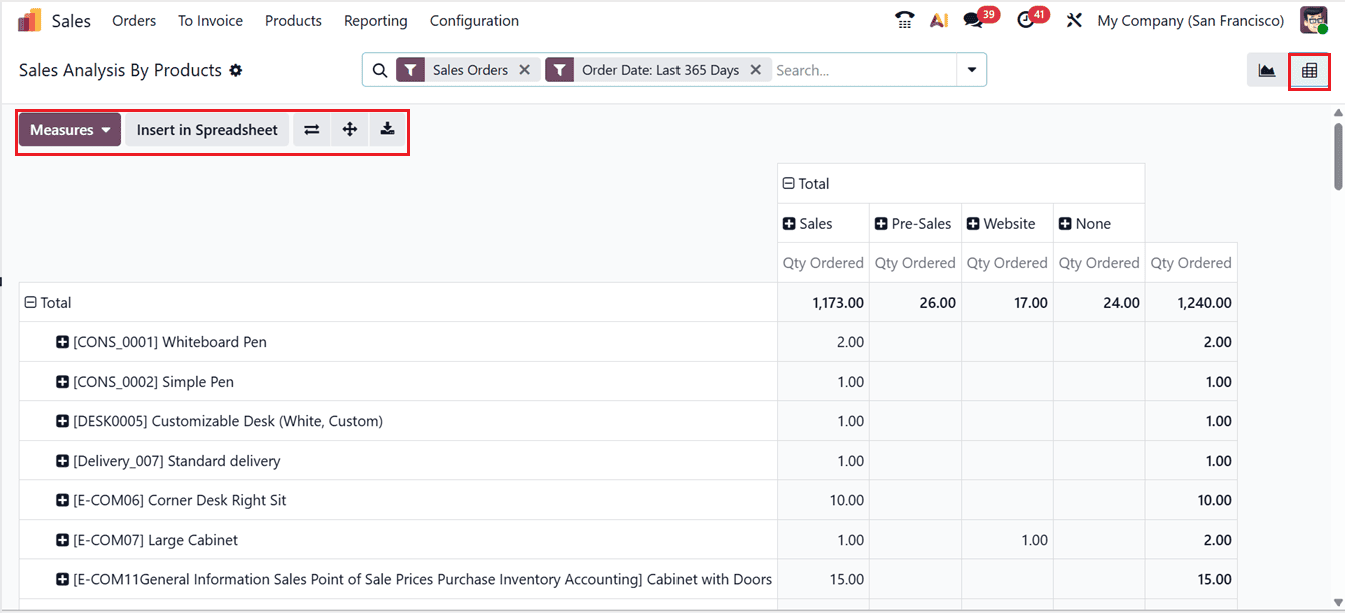
The Pivot view displays sales data in a structured, table-based format, making it easier to review and analyze detailed information.It offers helpful features like Flip Axis to change the data layout, Expand All to view detailed records, and Download XLSX to export reports to Excel for offline review.
The Graphical view presents sales data visually through Bar Charts, Line Charts, and Pie Charts, helping users easily identify trends, patterns, and performance variations over time.
The Filters and Group By options help narrow down the reports using specific conditions, making it easier to track sales performance and spot trends. Users can also create their own groups and filters with the Custom Group and Custom Filter options. Finally, the Favorites option allows you to save recently searched data.
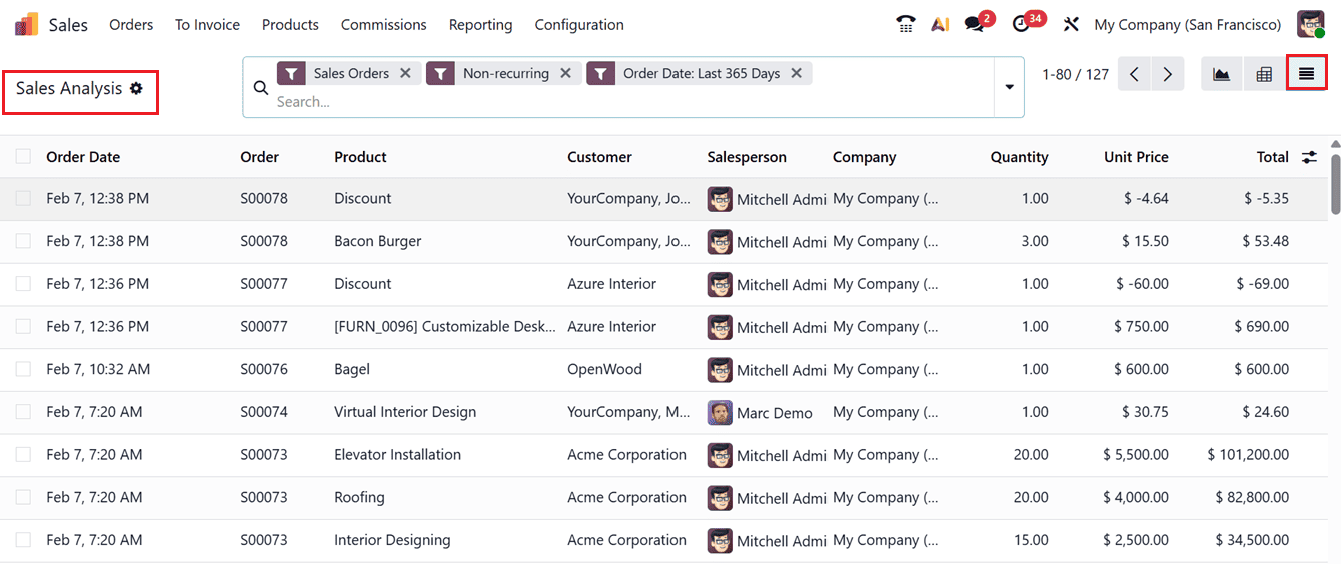
The List View of the sales analysis will show the dashboard of sales orders based on their Date, Order ID, Product, Customer, Salesperson, Company, Quantity, Unit Price and Total amount as shown in the screenshot below.
2. Salespersons
The Sales Analysis by Salespersons feature helps businesses review how each salesperson performs and contributes to revenue. This analysis supports better performance monitoring, target setting, and informed managerial decision-making. To view this report, go to the Reporting tab and choose the Salespersons option.
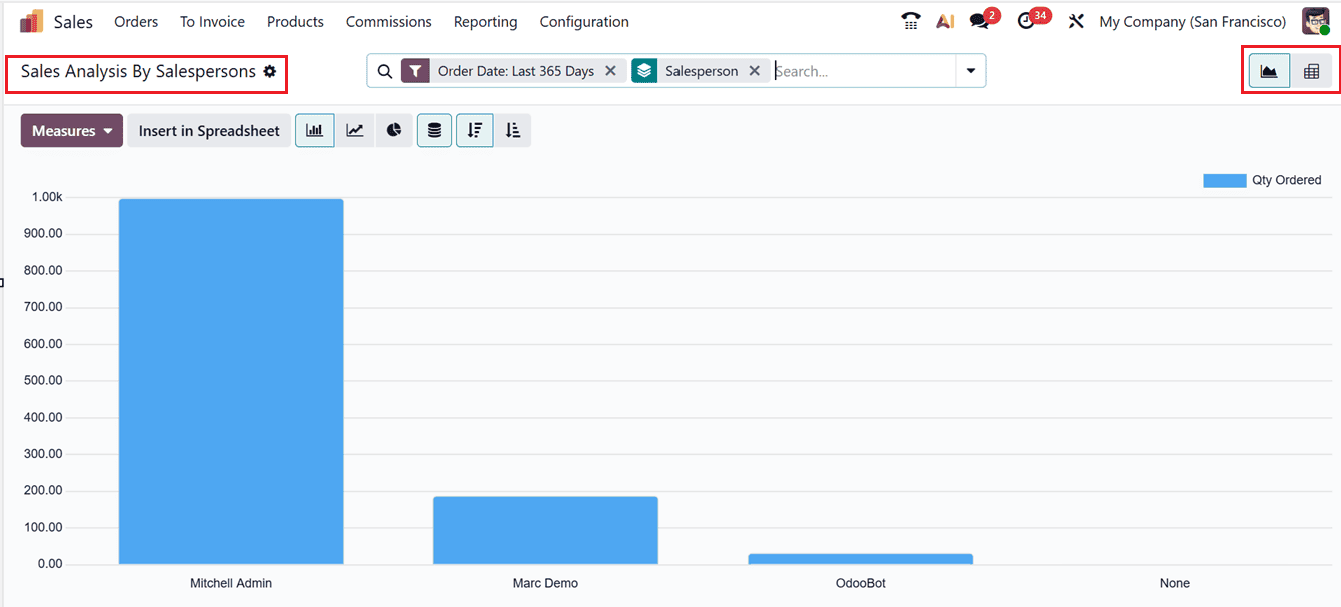
The sales analysis graph in the Salespersons reporting window presents a clear visual representation of performance, where individual salespersons are displayed along the X-axis and the quantity of products ordered is shown on the Y-axis, allowing users to easily compare sales volumes, evaluate individual contributions, and identify performance trends at a glance,as shown in the screenshot below.
The Group By option enables segmentation of data based on multiple parameters, while additional Filters such as date ranges or specific orders help further refine the report. Also, the Favorites option helps you to save the recent searches for thorough analysis.
The Graphical view includes different graphical representations to get detailed analysis based on the required parameters.
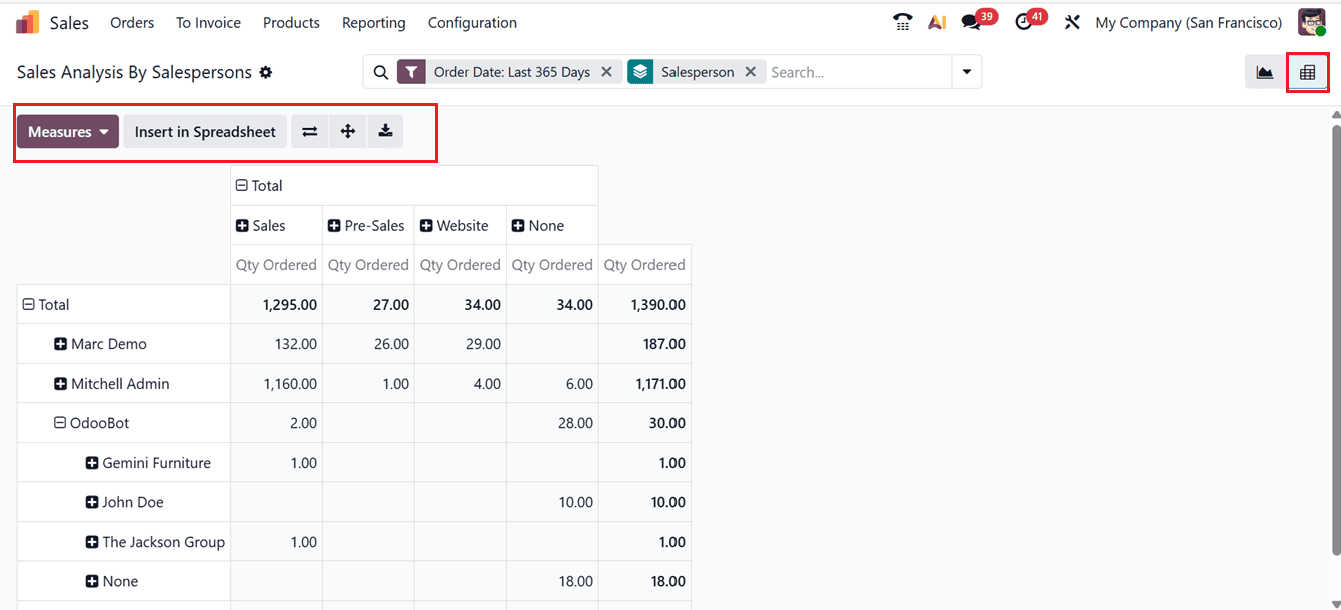
The Pivot view shows a clear summary of total sales, revenue, and order quantities for each salesperson. You can also export this report using Download XLSX for further review and record storage.
3. Products
The Sales Analysis by Products feature helps track how individual products perform, making it easier to plan inventory, set prices, and improve overall sales activities. By accessing the Reporting tab, you can generate detailed reports covering product sales, revenue, and performance trends, as shown in the screenshot below.
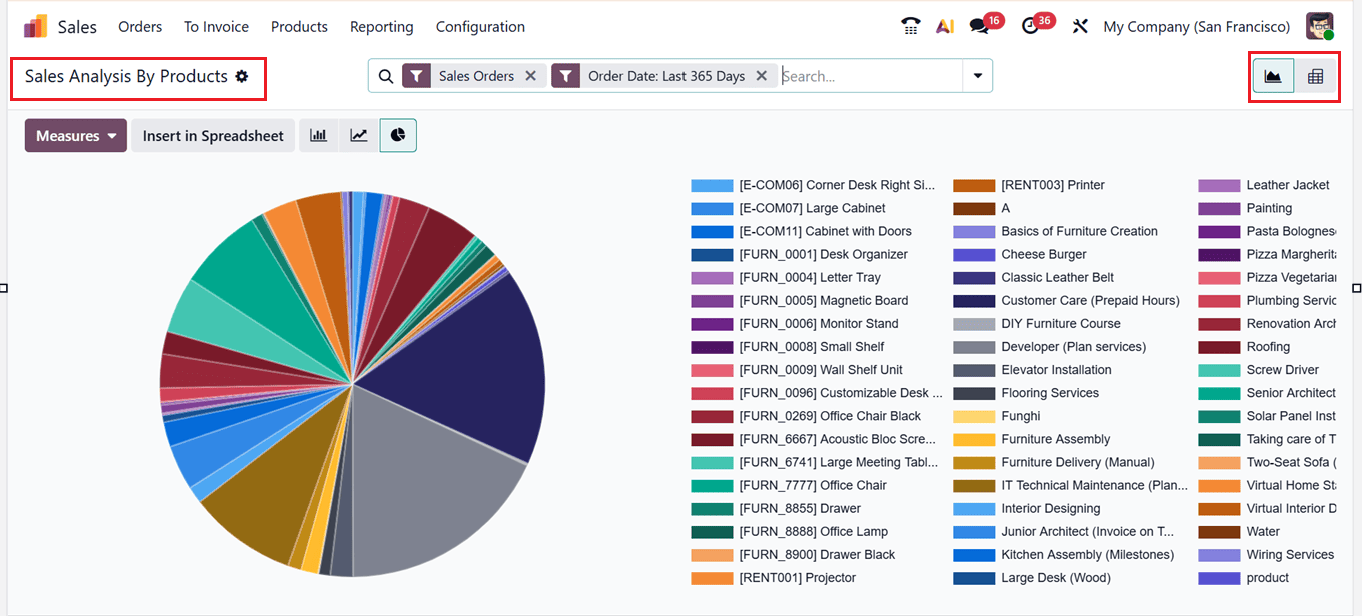
Using the filtering and grouping options provided in the advanced search bar area, businesses can refine reports by product categories, individual products, or specific time periods. These reports can be viewed as bar, line, or pie charts, as well as detailed pivot tables, making the data easy to understand and use for decisions.
From this reporting section, you can evaluate high-performing and underperforming products enabling businesses to make informed adjustments to inventory management and marketing strategies.
4. Customers
The Sales Analysis by Customers feature helps businesses review sales results for each customer. It shows buying patterns, revenue contribution, and customer value. By going to the Reporting tab and filtering data by customer, businesses can study key customers and spot sales trends. These reports can be further adjusted using filters and group-by options.

Also, you can change the graphical parameters using the ‘Measures’ button including; Discount, Discount Amount, Margin, Gross Weight, Qty Delivered, Qty Invoiced, Qty Ordered, Qty To Deliver, Qty To Order, Total, Unit Price and many more.
The Graph view displays customer sales data using bar, line, and pie charts for clear visual analysis. Using the Pivot view, you will get a structured sales data with metrics such as total sales, quantities sold, and generated revenue.
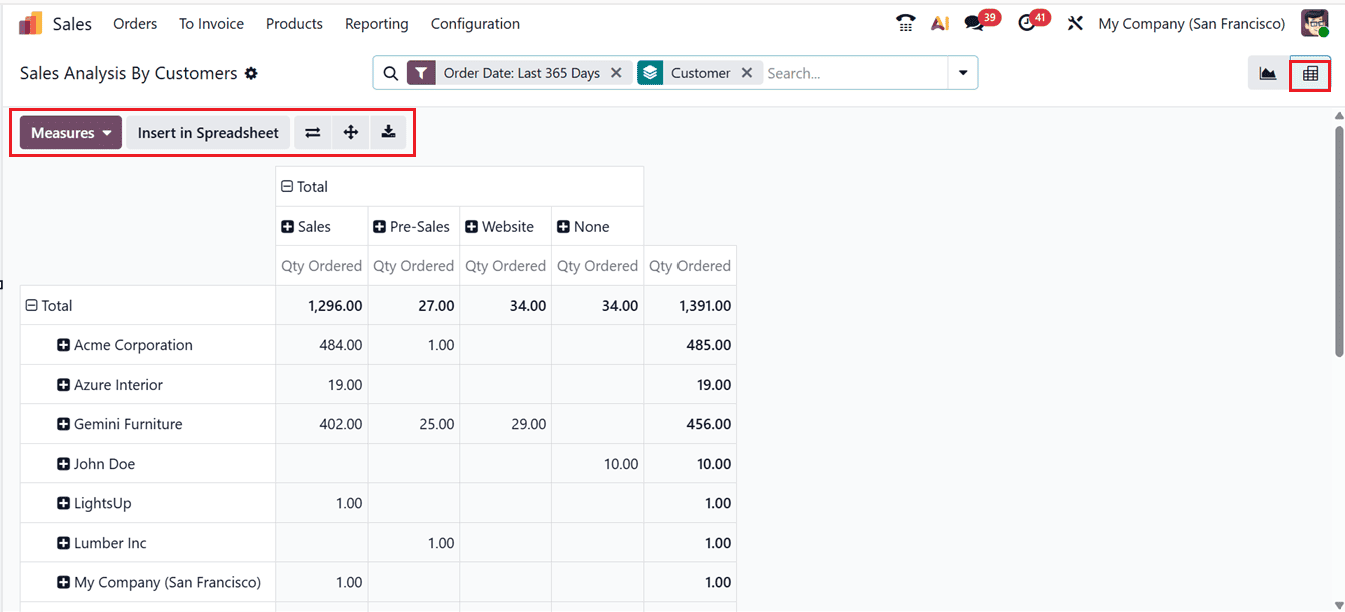
This customer-focused analysis helps identify loyal and high-value customers, measure profitability, and create targeted marketing strategies to improve retention. It also points out low-performing customer groups, allowing businesses to improve their sales approach.
5. Commissions
In the Odoo 19 Sales module, the Commissions Reporting feature provides clear insights into sales team and salesperson performance by showing earned commissions in an organized way. These reports help businesses evaluate the effectiveness of commission structures, track target achievements, and measure the return on incentive programs.
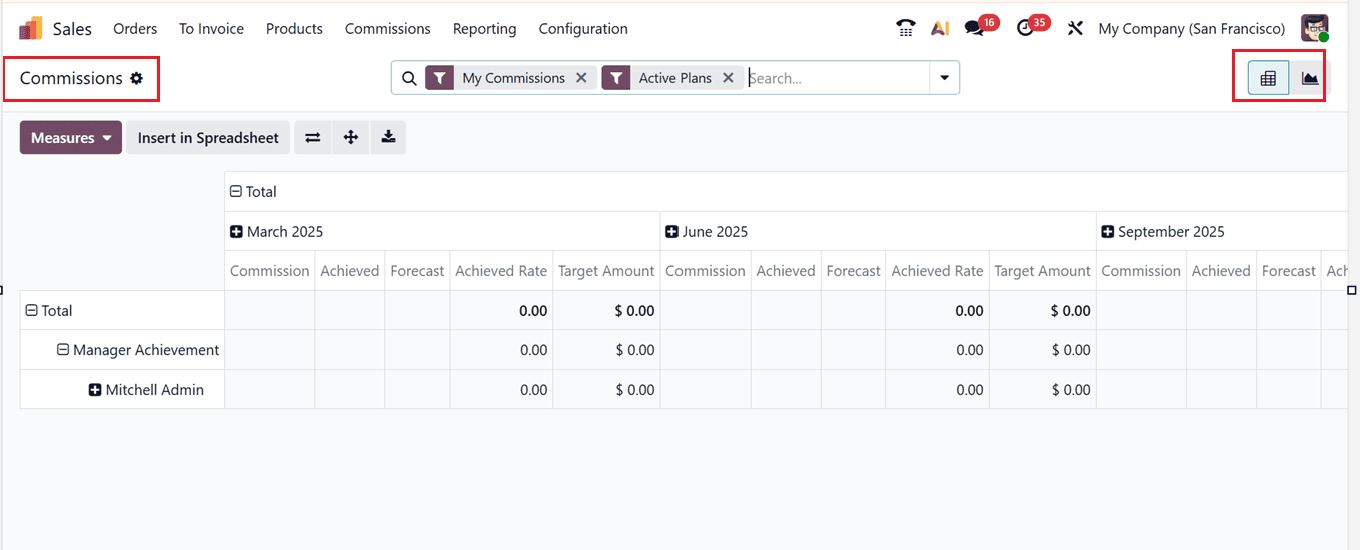
Users can access commission data through various views, including Pivot and Graph, allowing flexible analysis based on parameters such as commission plans, salesperson, date range, target percentages, and achievement rates. The Pivot view allows flexible grouping and filtering for custom summaries, while the Graph view shows monthly commission trends visually, as shown in the screenshot below.
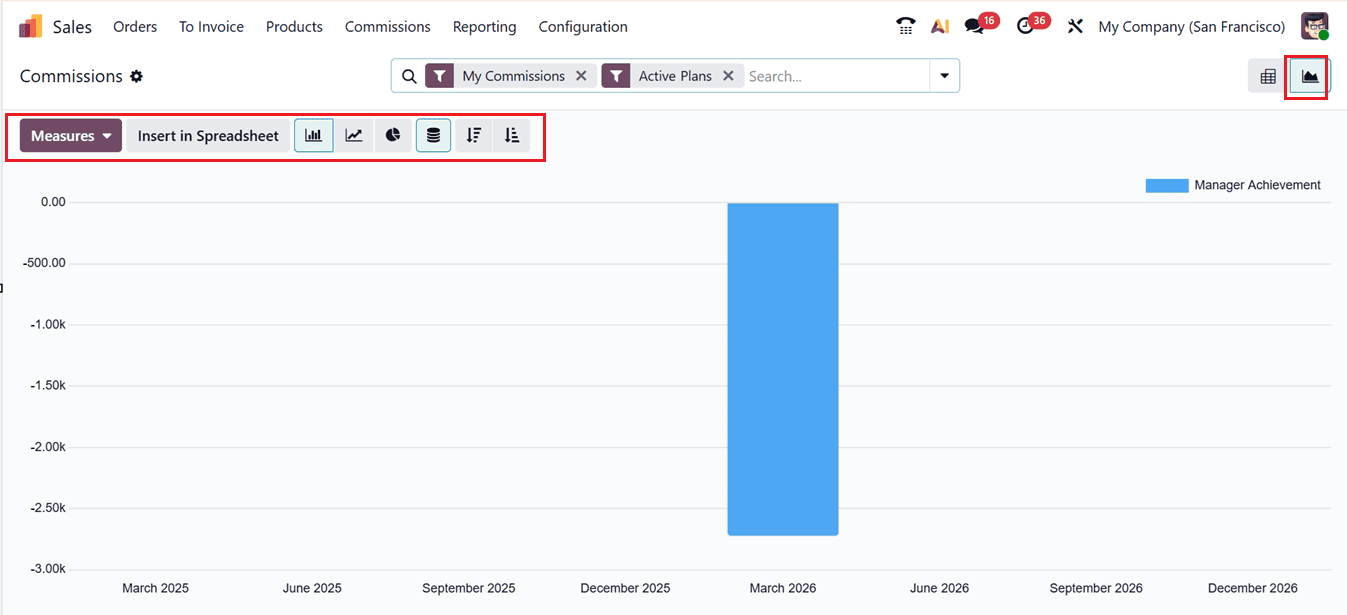
Using the ‘Measures’ section, you can change the reporting measures to commission Achieved, Achieved Rate, Commission, Forecast, Target Amount and Count. Using the advanced search bar, you can utilize the Filters, Group By and Favorites options to get customized analysis to get a comprehensive overview. Managers can elevate overall sales performance, modify commission programs, and make better assessments with the aid of these tools.
Overall, the Sales Reporting tools in Odoo 19 provide powerful, data-based insights that help businesses improve sales strategies, track performance more effectively, and support long-term growth.
To read more about How to Maximize Business Growth with Odoo 18 Sales Report, refer to our blog How to Maximize Business Growth with Odoo 18 Sales Report.