The Odoo 19 Dashboard module is a flexible tool that enables an organization to monitor and analyze important KPIs in real time. The Odoo 19 Dashboard module collects data from various Odoo modules such as Sales, Inventory, CRM, Accounting, HR, and others, ensuring that all business performance data is available in one place. Flexible and customizable dashboards allow organizations to make wise decisions based on data analysis. This blog post aims to discuss the Odoo 19 Dashboard module in detail.
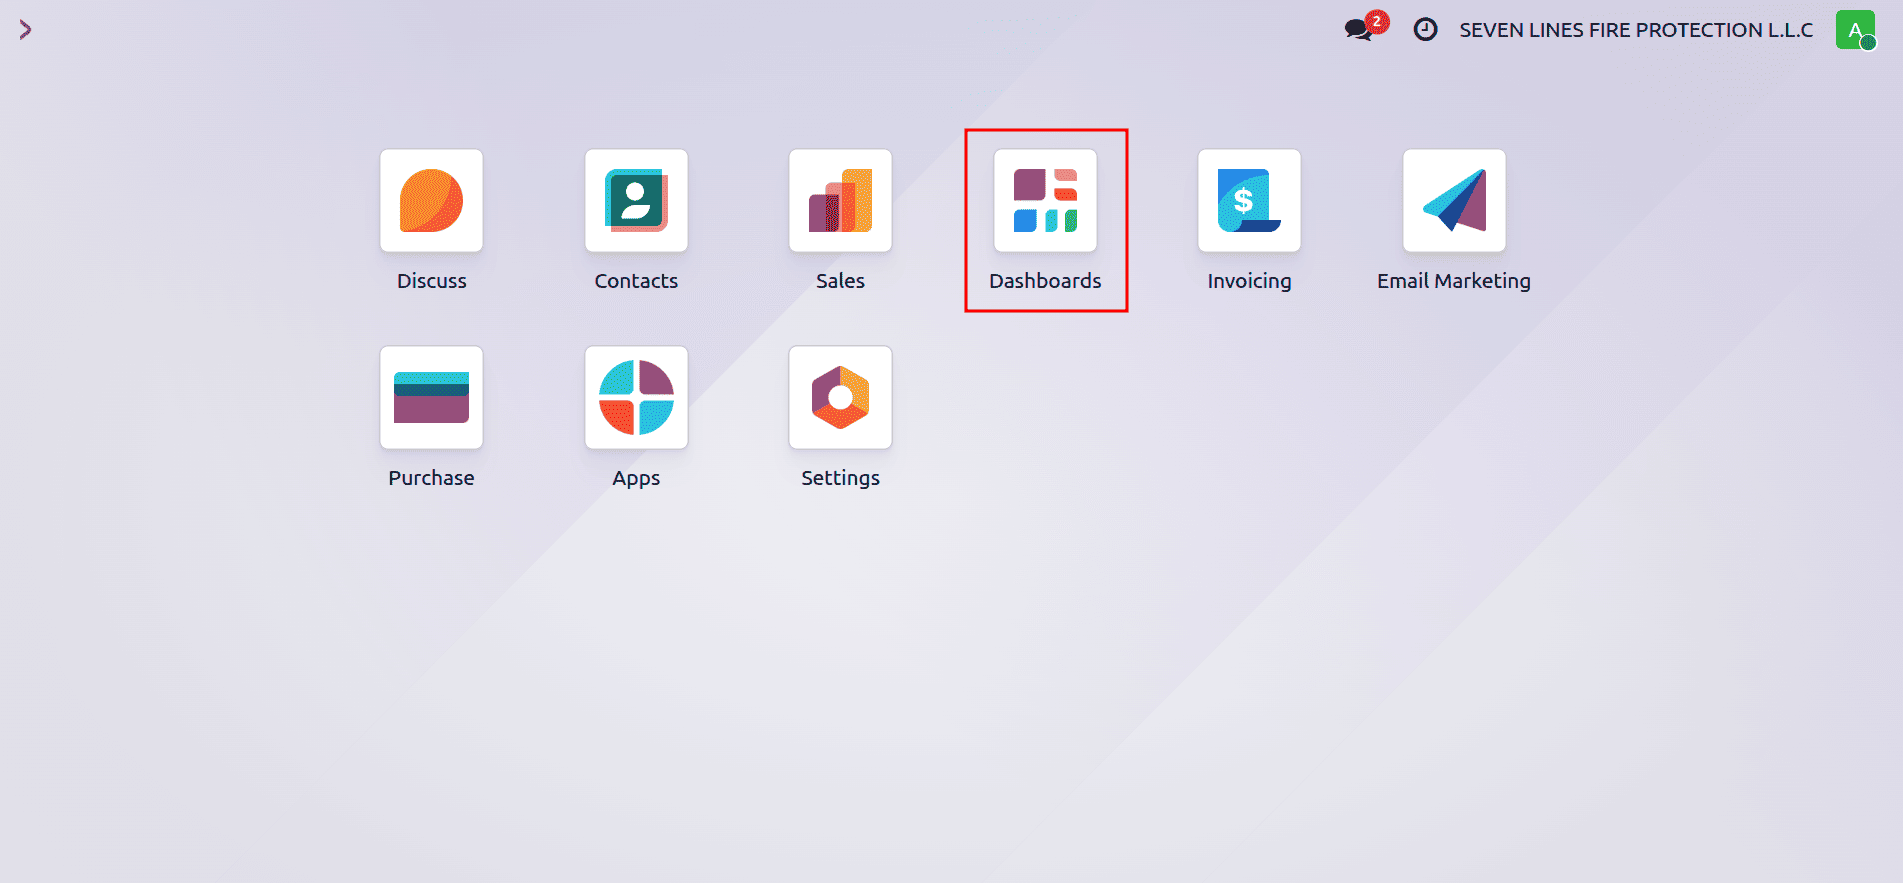
To get started, open the Dashboard module from the Odoo 19 Apps menu.
1. Sales
1.1 Sales
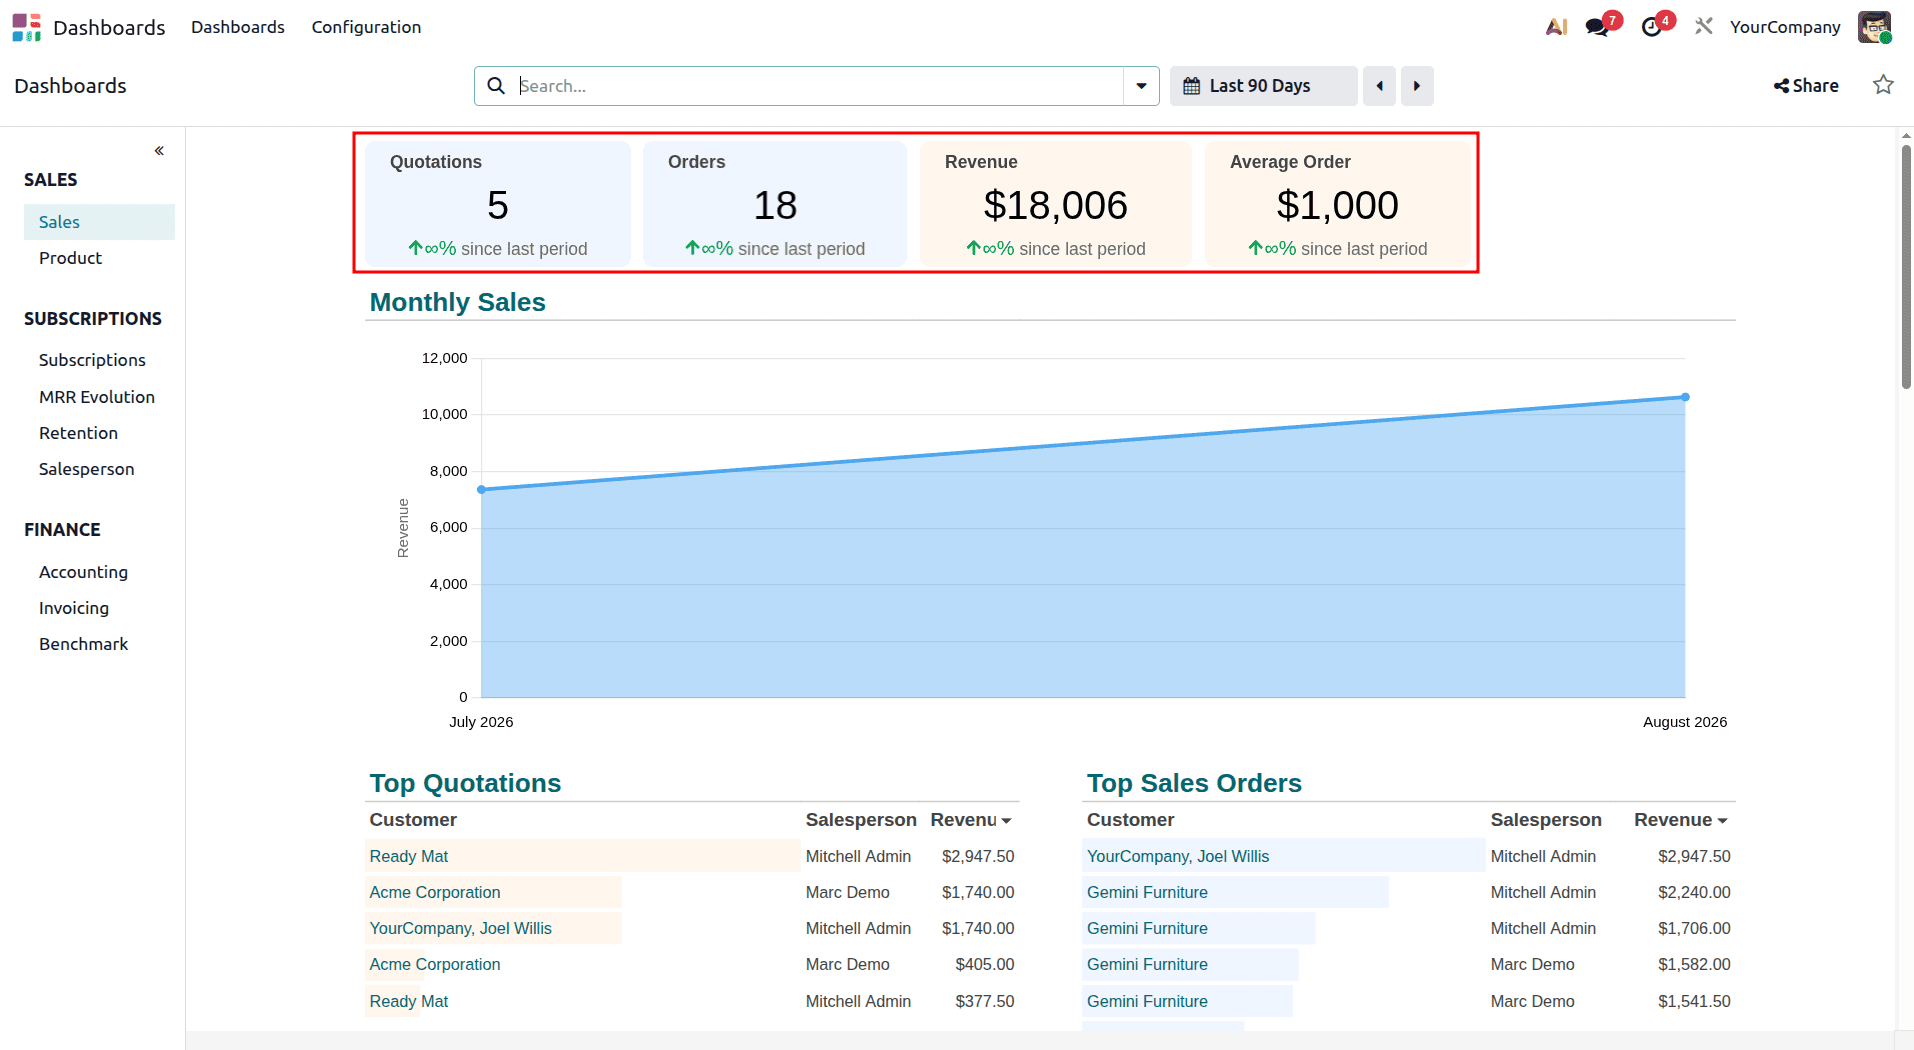
Right after the user accesses the Dashboard module, the sales section displays key statistics such as quotations, sales orders, and revenue at the top. Moreover, it provides visualizations for the above-mentioned statistics in order to facilitate analysis of the sales performance on behalf of the user.
Next to Sales, the Dashboard module also offers users a single point for collecting statistics from different Odoo modules. The list includes modules such as Subscriptions, CRM, Finance, Logistics, Services, Marketing, Website, and Human Resources.
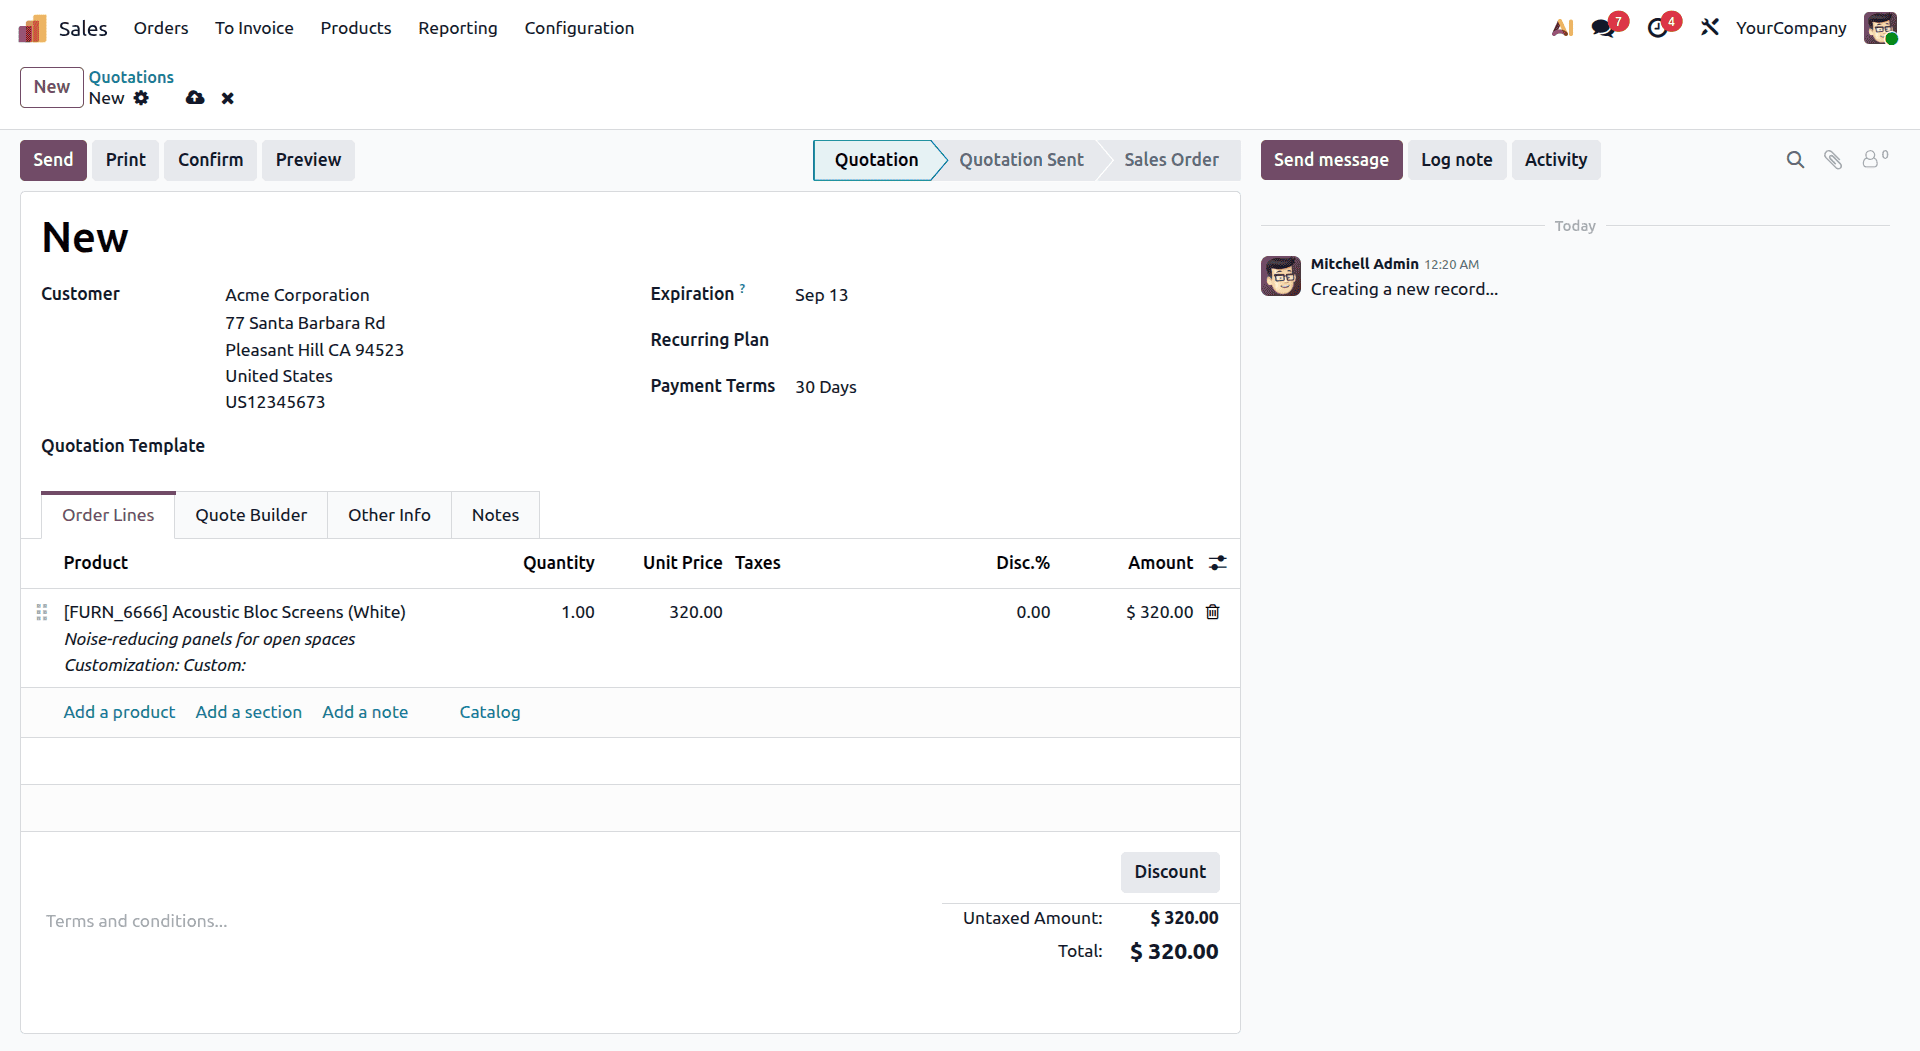
To understand how the Dashboard module updates in real time, navigate to the Sales module and create a new quotation.
Click the New button to create a new quotation. Then, select a Customer, and under the Order Lines tab, add the desired product, as shown below.
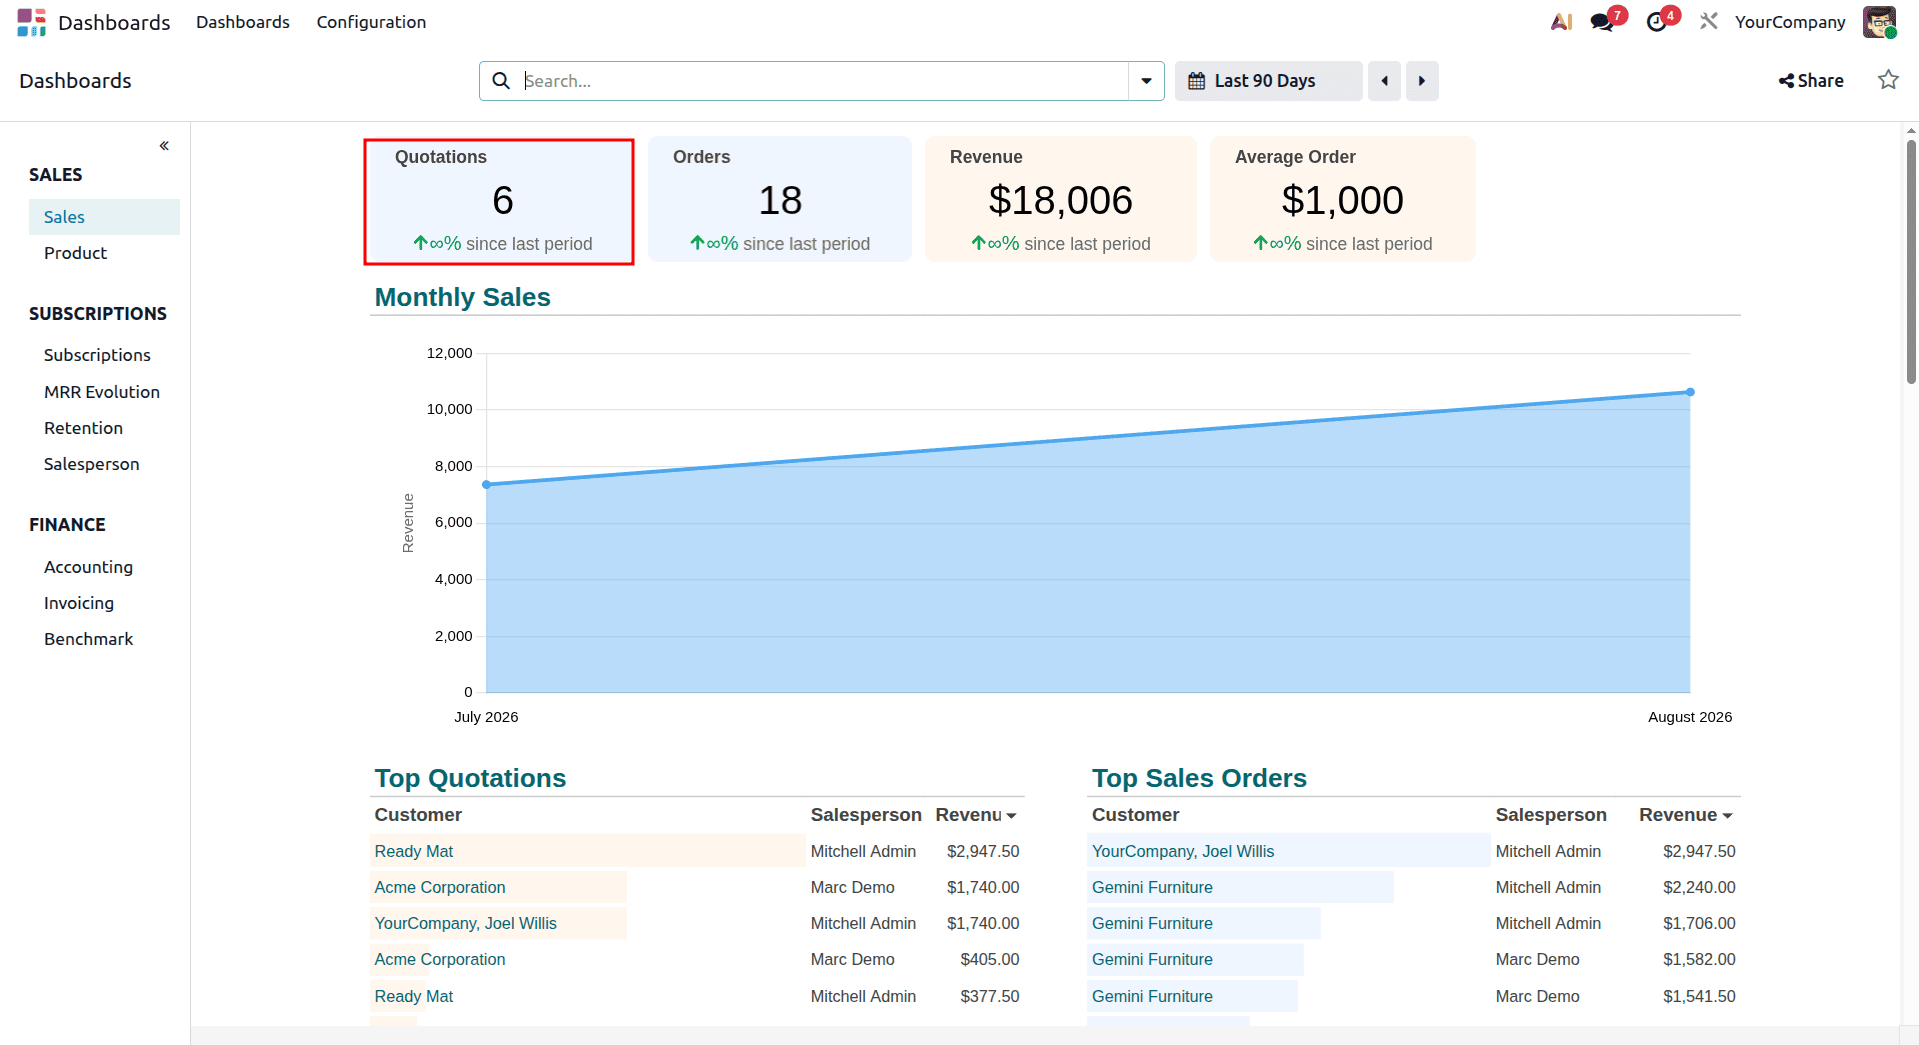
Return to the Dashboard module and notice the difference. The metric "Quotations" will be updated automatically because you have just added a new quotation. Here, we can see how the Dashboard module monitors your business activity on the go.
Next, return to the Sales module and open the quotation that you have created. Click the Confirm button to convert the quotation into a Sales Order.
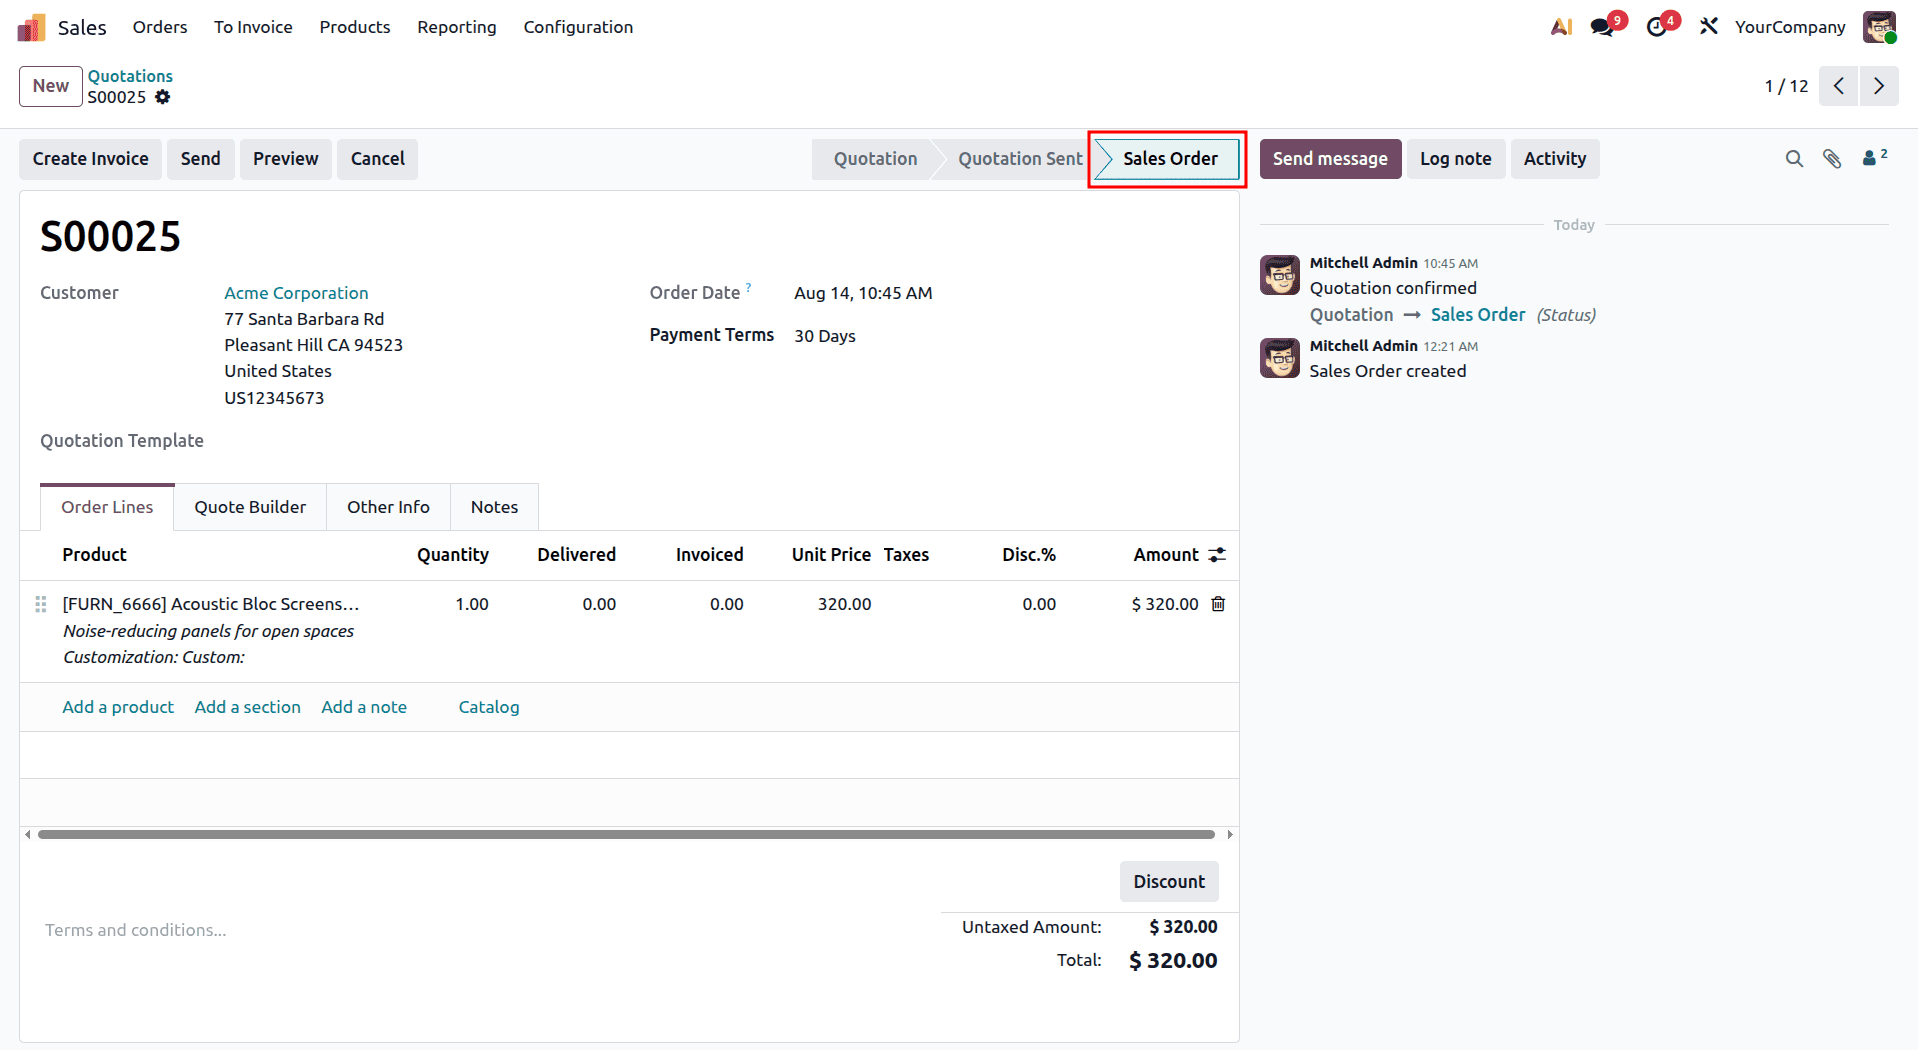
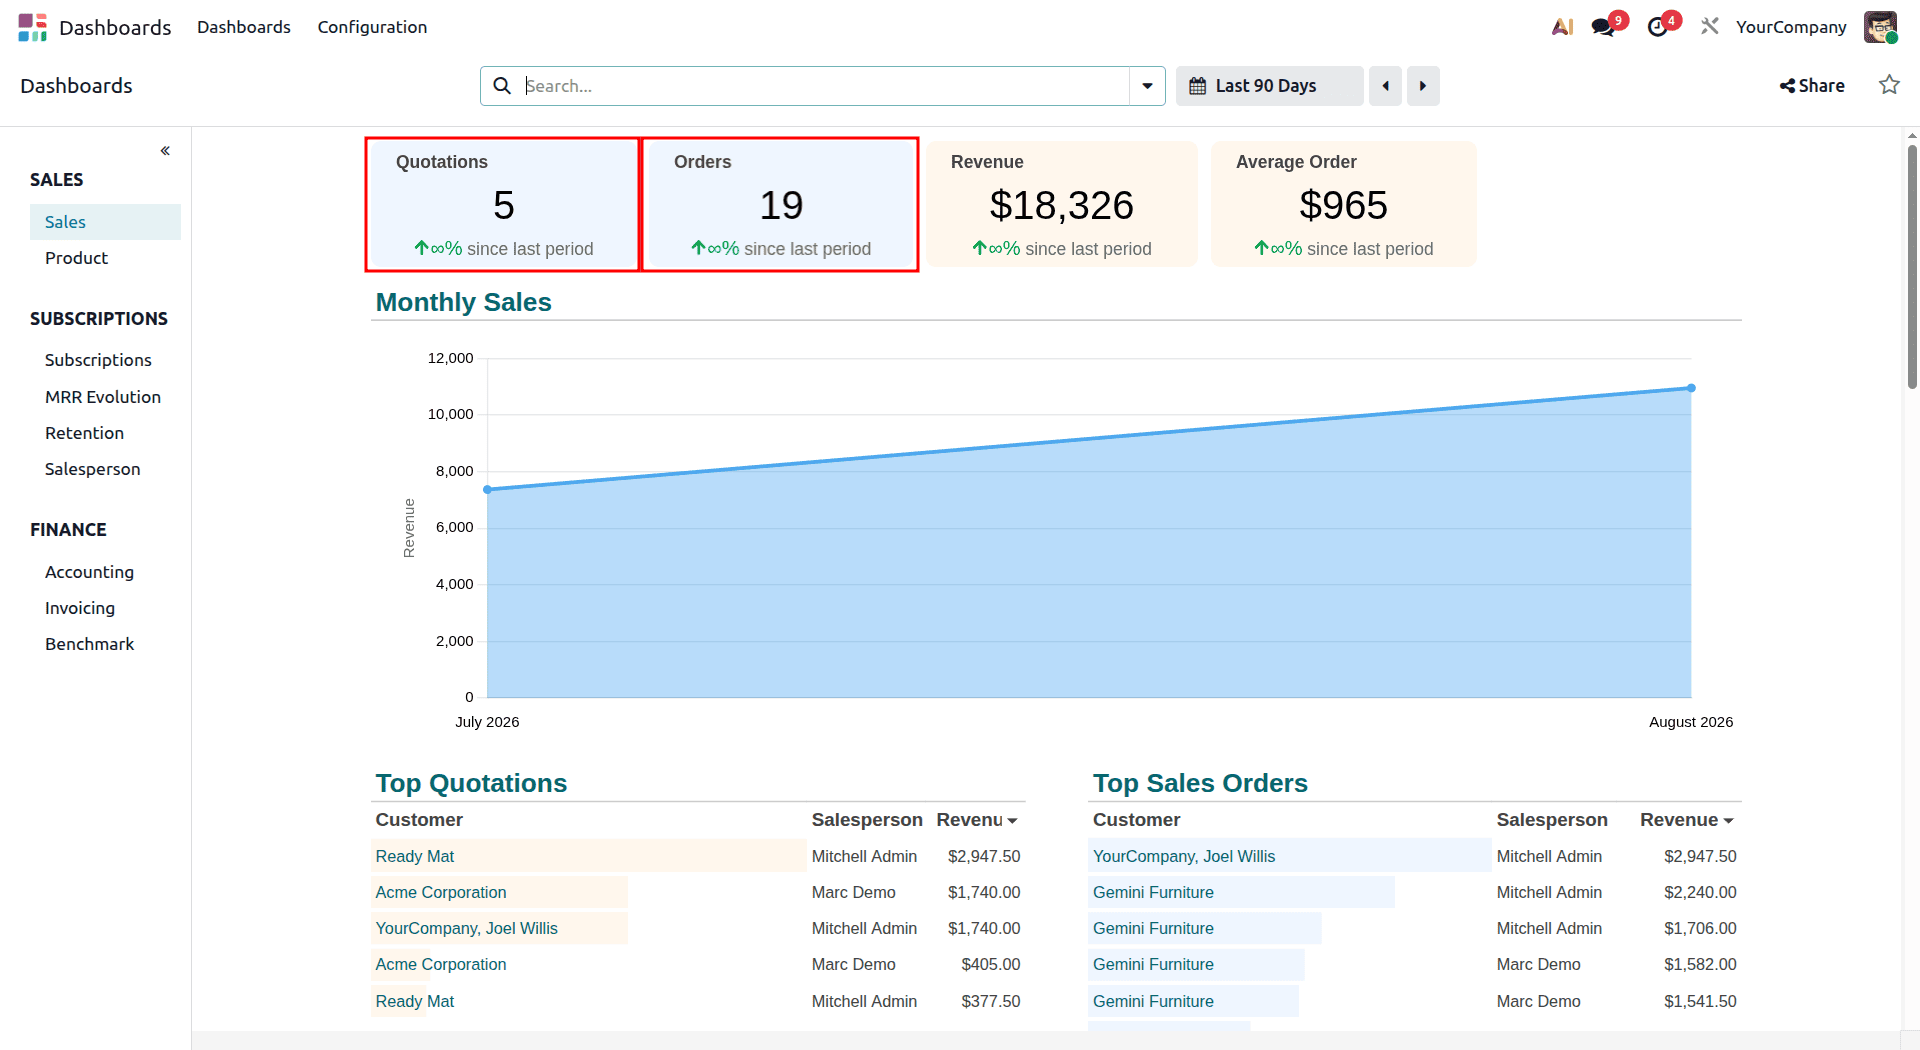
Go to the Dashboard section to view the new sales metrics. Once the quotation is confirmed, there will be a decrease in the number of quotations, as well as an increase in the number of sales orders, which means that the quotation has been transformed into a sales order.
There is also a Monthly Sales chart available on the Dashboard, which gives a visual analysis of the sales performance, as illustrated below.
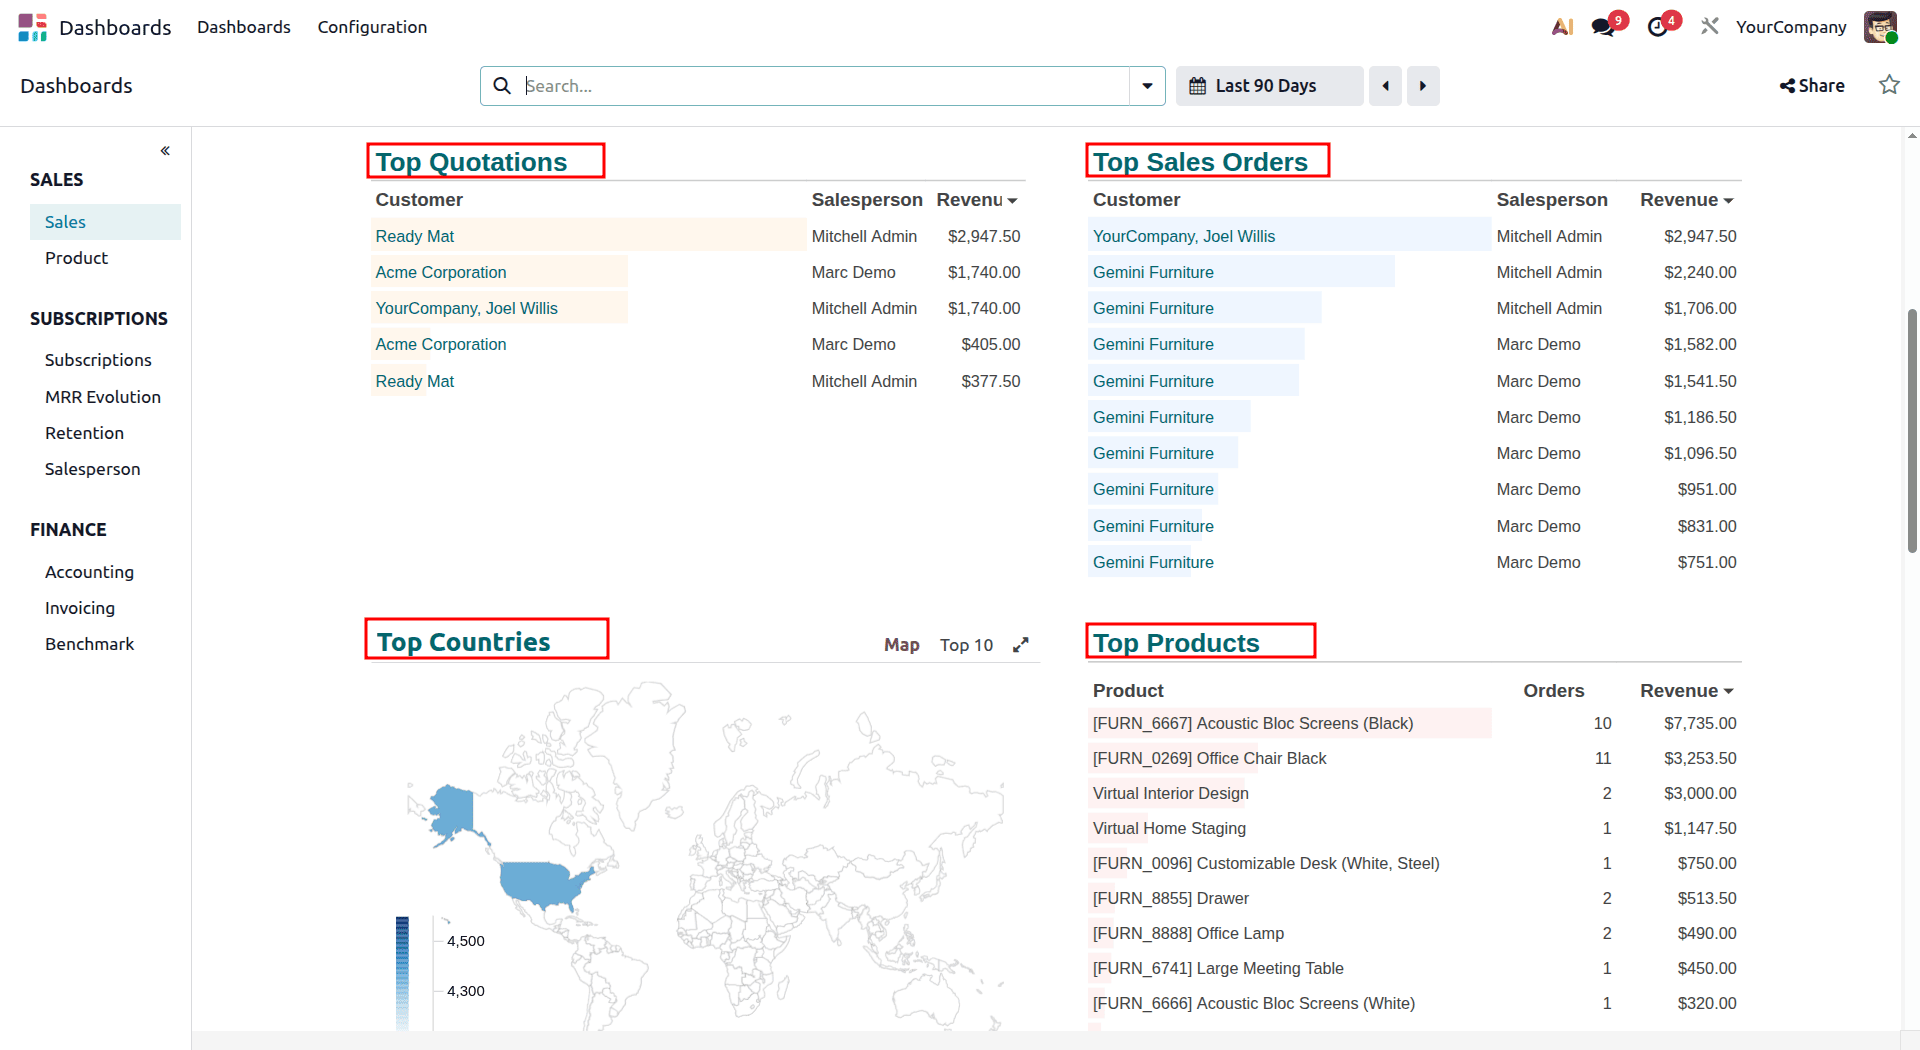
The Dashboard also displays a list of the Top Quotations and Top Sales Orders, allowing users to quickly identify their highest-value transactions. In addition, it provides insights into the country from which each order originated and the products included in those orders. These analytics help businesses better understand their sales performance, customer distribution, and product demand.
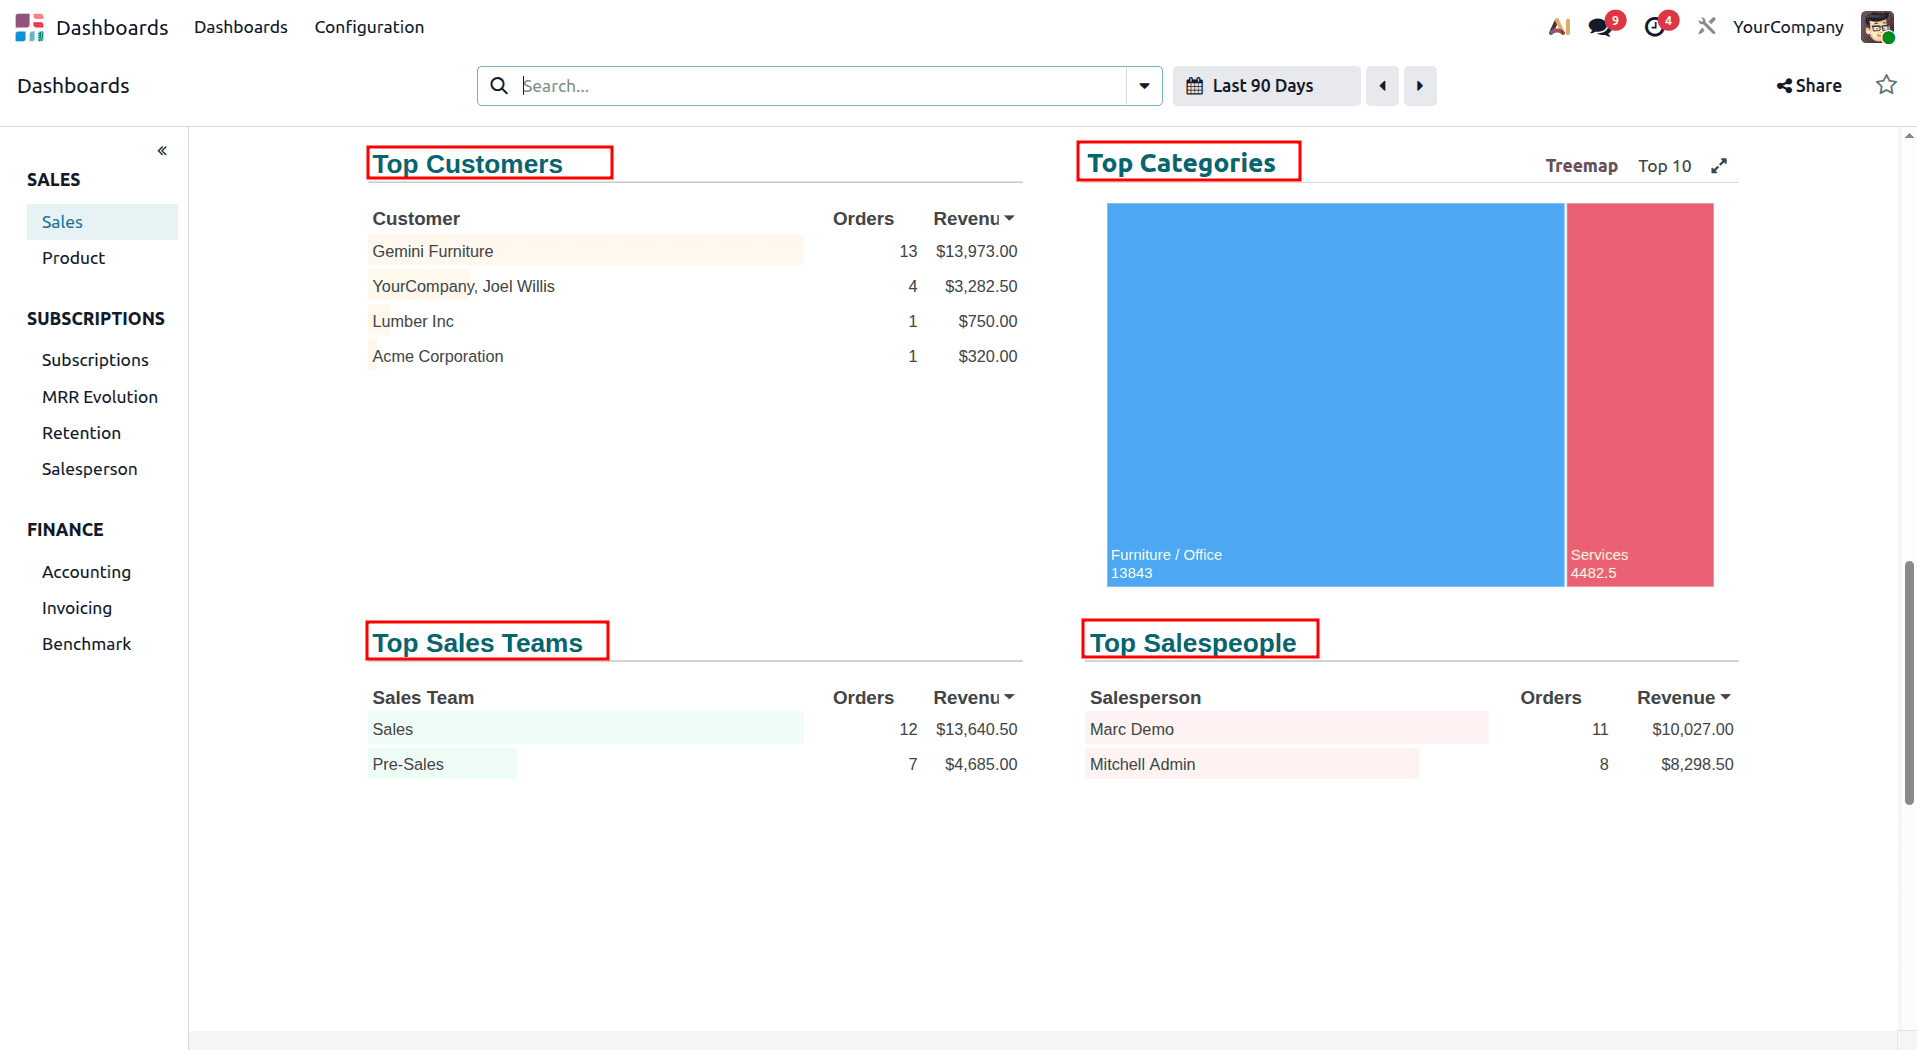
The Dashboard also highlights the Top Customers, Product Categories, Sales Teams, and Salespeople based on sales performance. These insights help users identify their most valuable customers, best-performing product categories, high-achieving sales teams, and top sales representatives, enabling more informed business decisions.
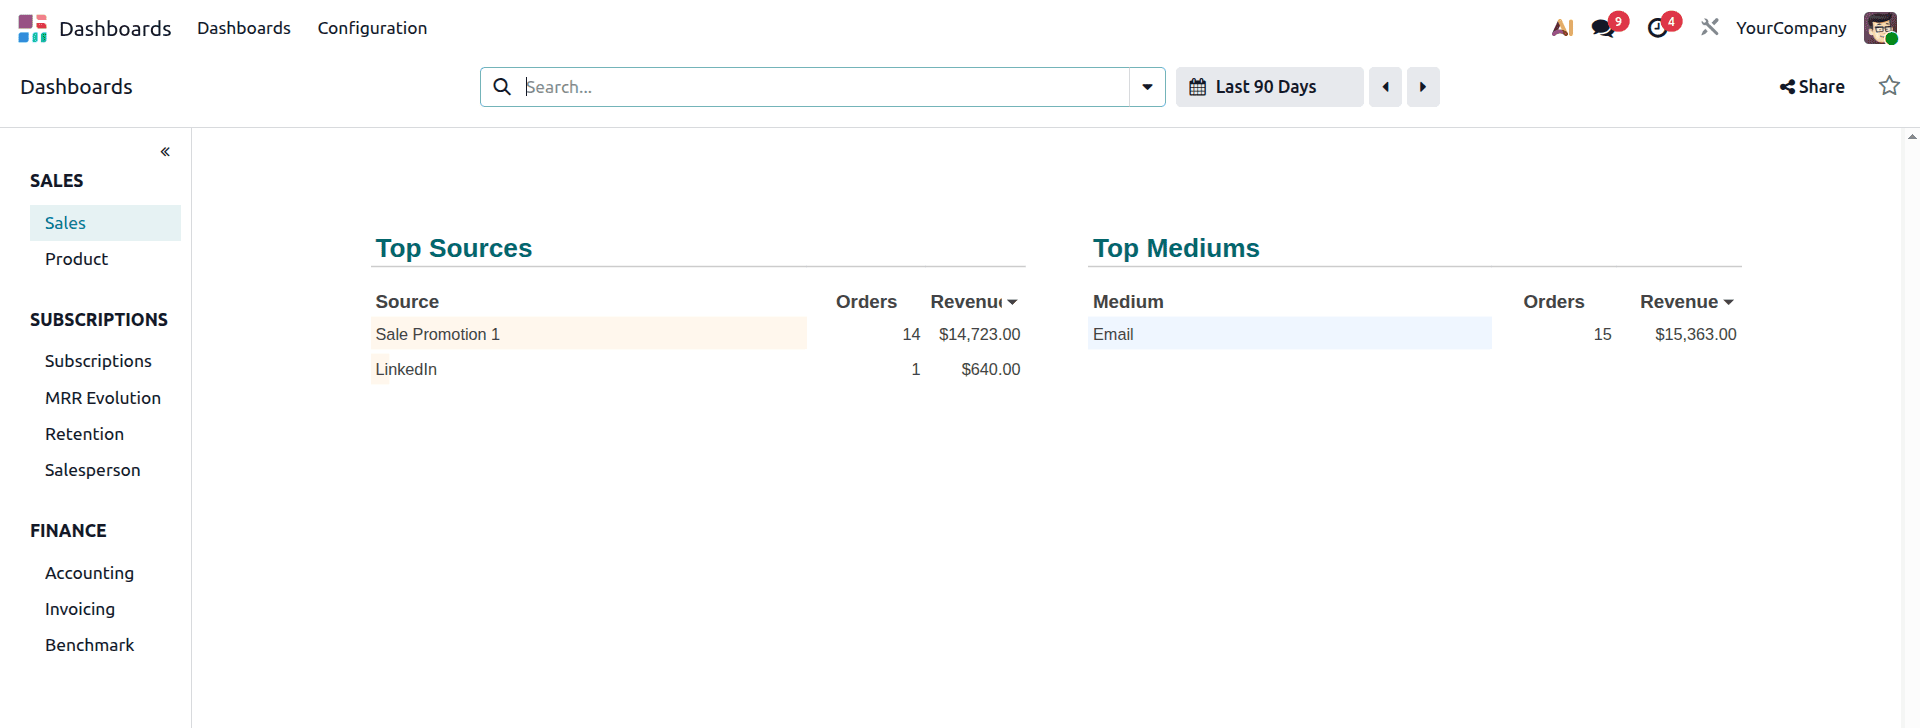
The Dashboard also displays the Top Sources and Top Mediums, providing insights into the channels that generate the most sales opportunities and customer interactions. These analytics help businesses evaluate the effectiveness of their marketing campaigns and identify the sources and media that contribute most to lead generation and conversions.
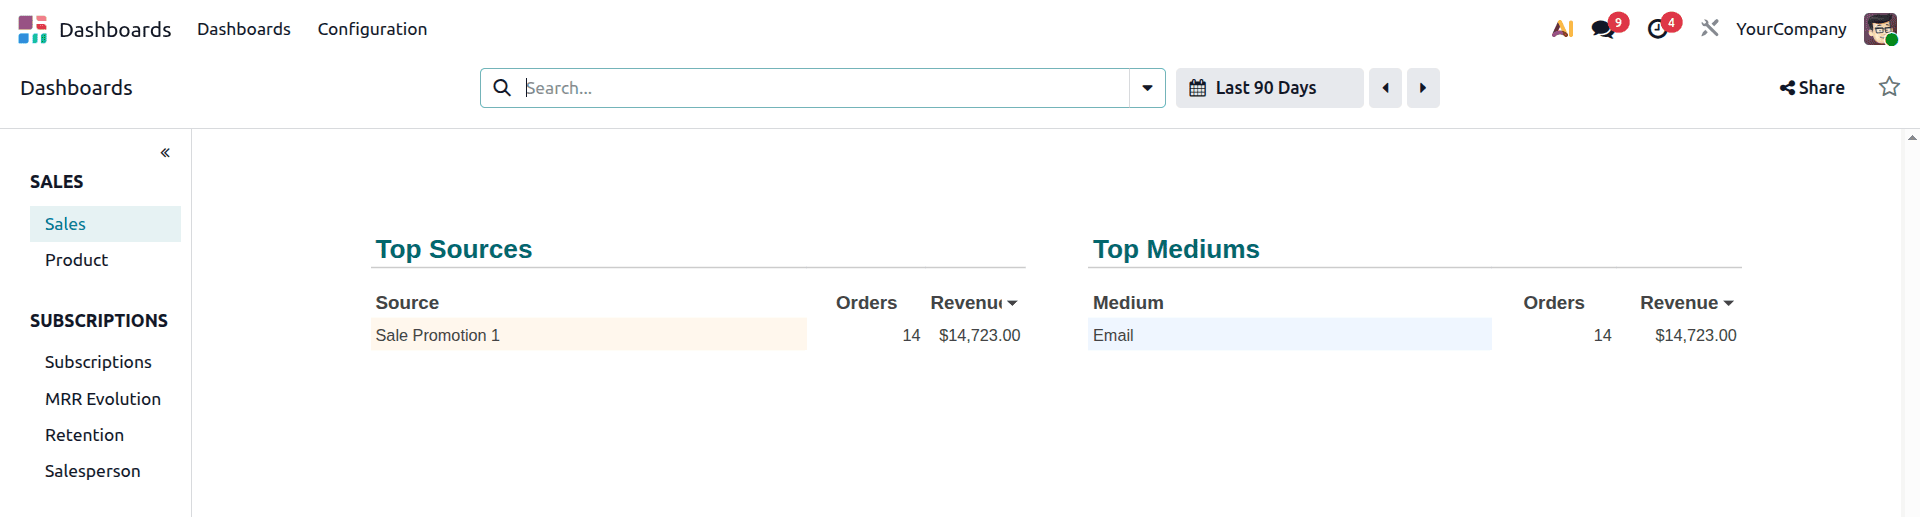
Next, return to the Sales module and open the sales order you created. Click the Action menu and select Duplicate to create a copy of the existing sales order, as shown below.
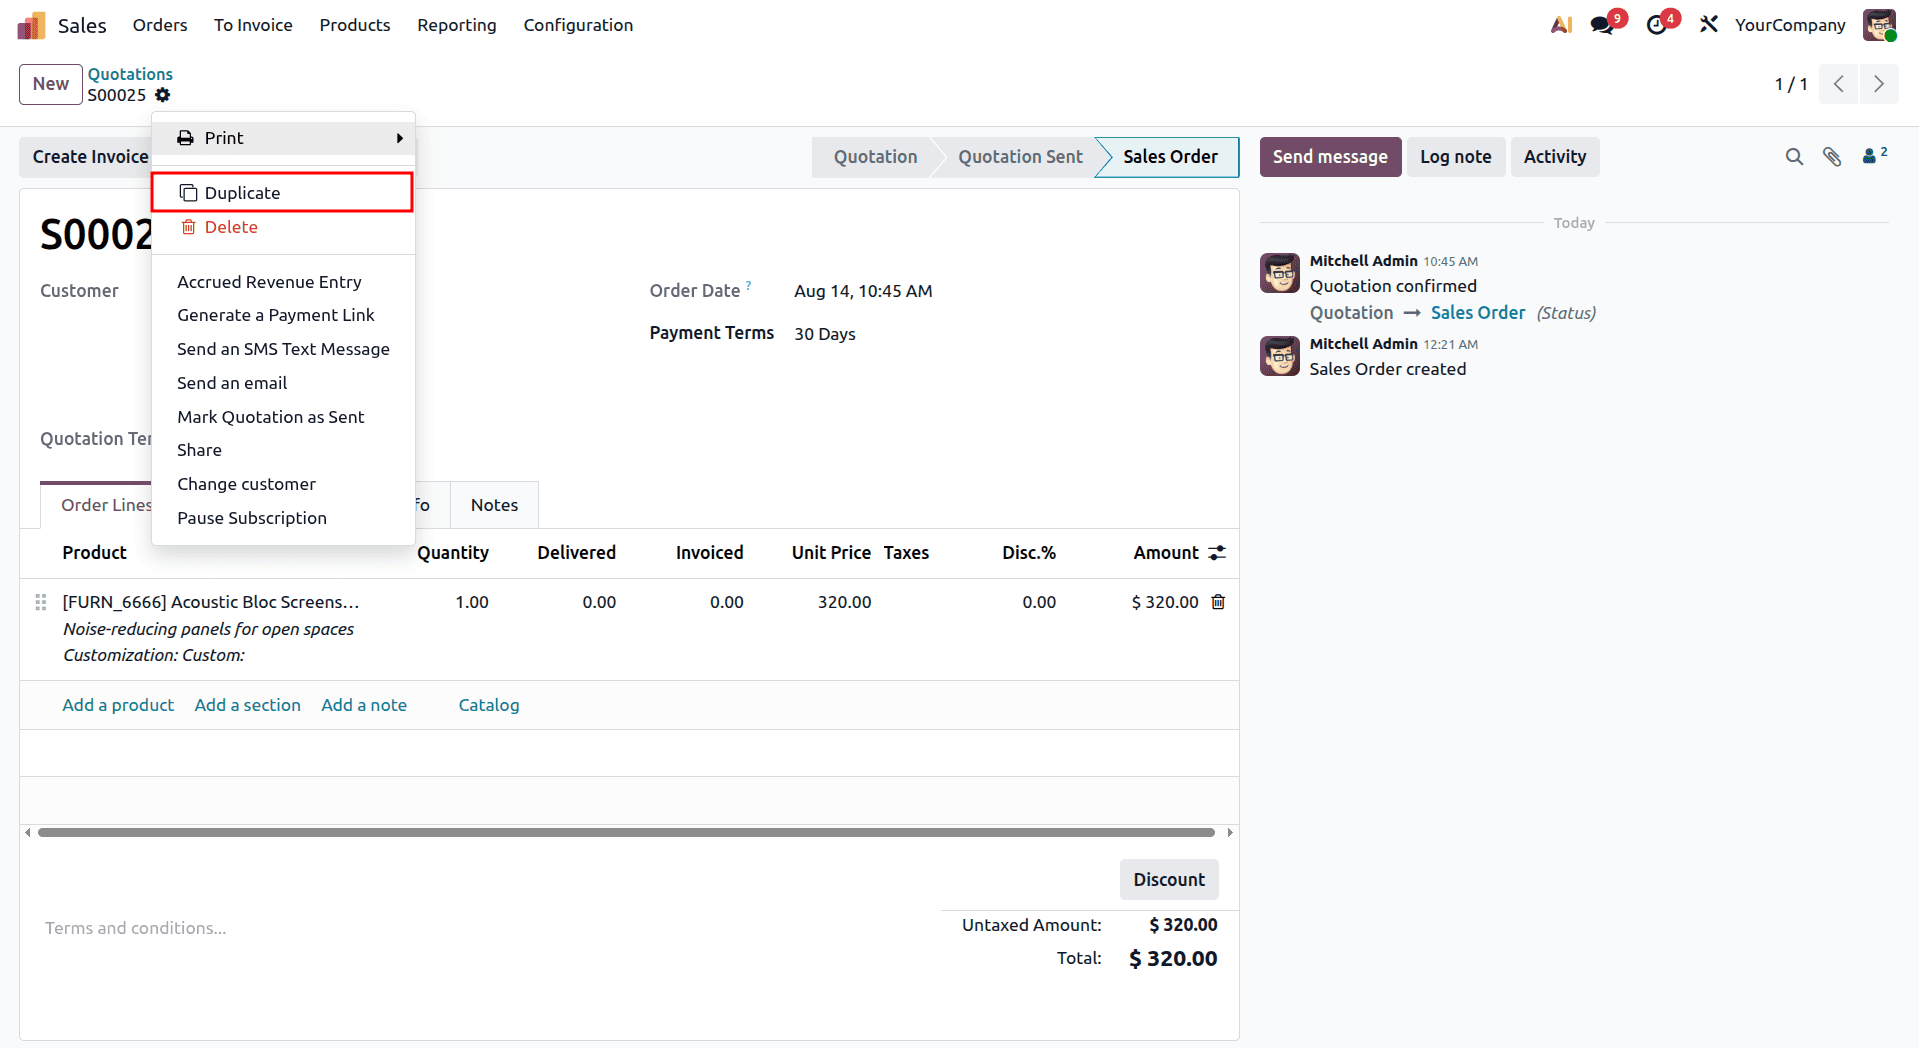
Open the newly duplicated sales order, navigate to the Order Lines tab, and update the Quantity to 2 or any other desired value, as shown below.
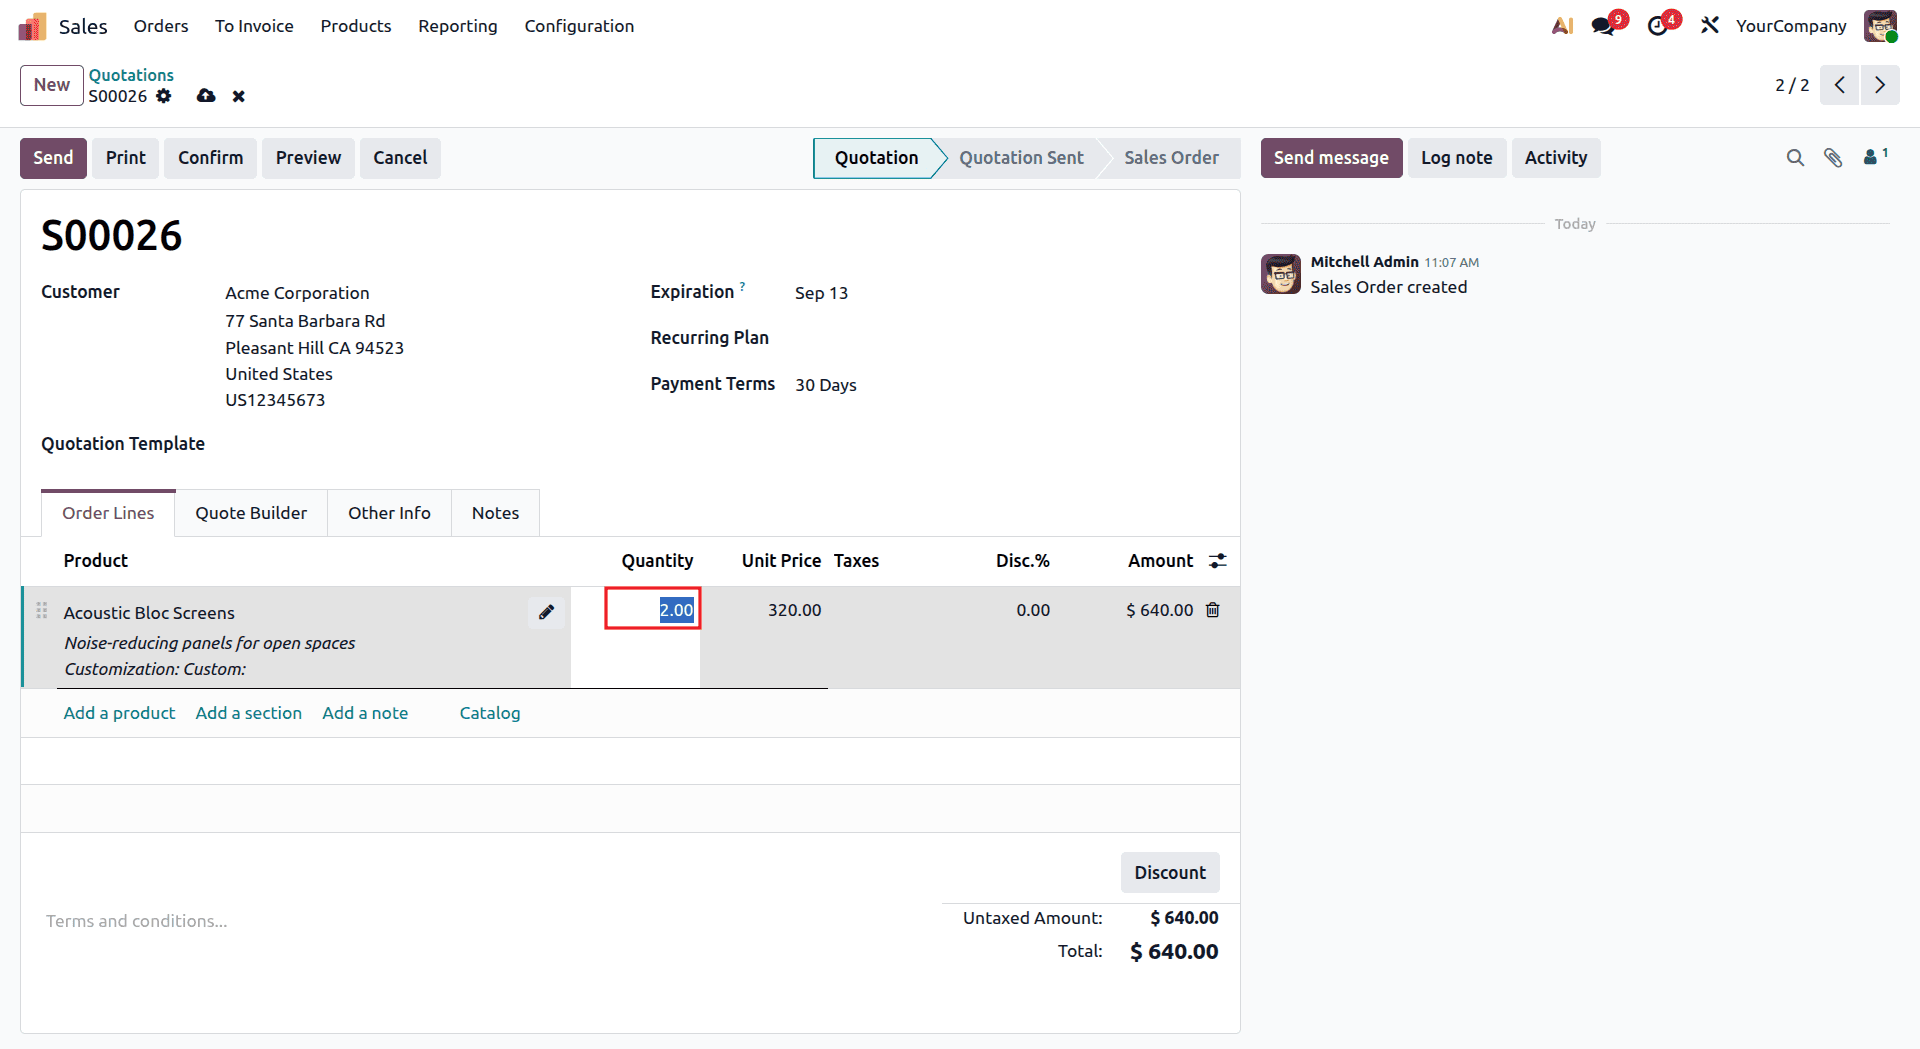
Next, navigate to the Other Info tab. Under the Tracking section, enter the relevant details, including the Source Document, Opportunity, Campaign, Medium, and Source.
Once the required information has been added, click Save, then confirm the sales order. Finally, register the payment to complete and confirm the transaction.
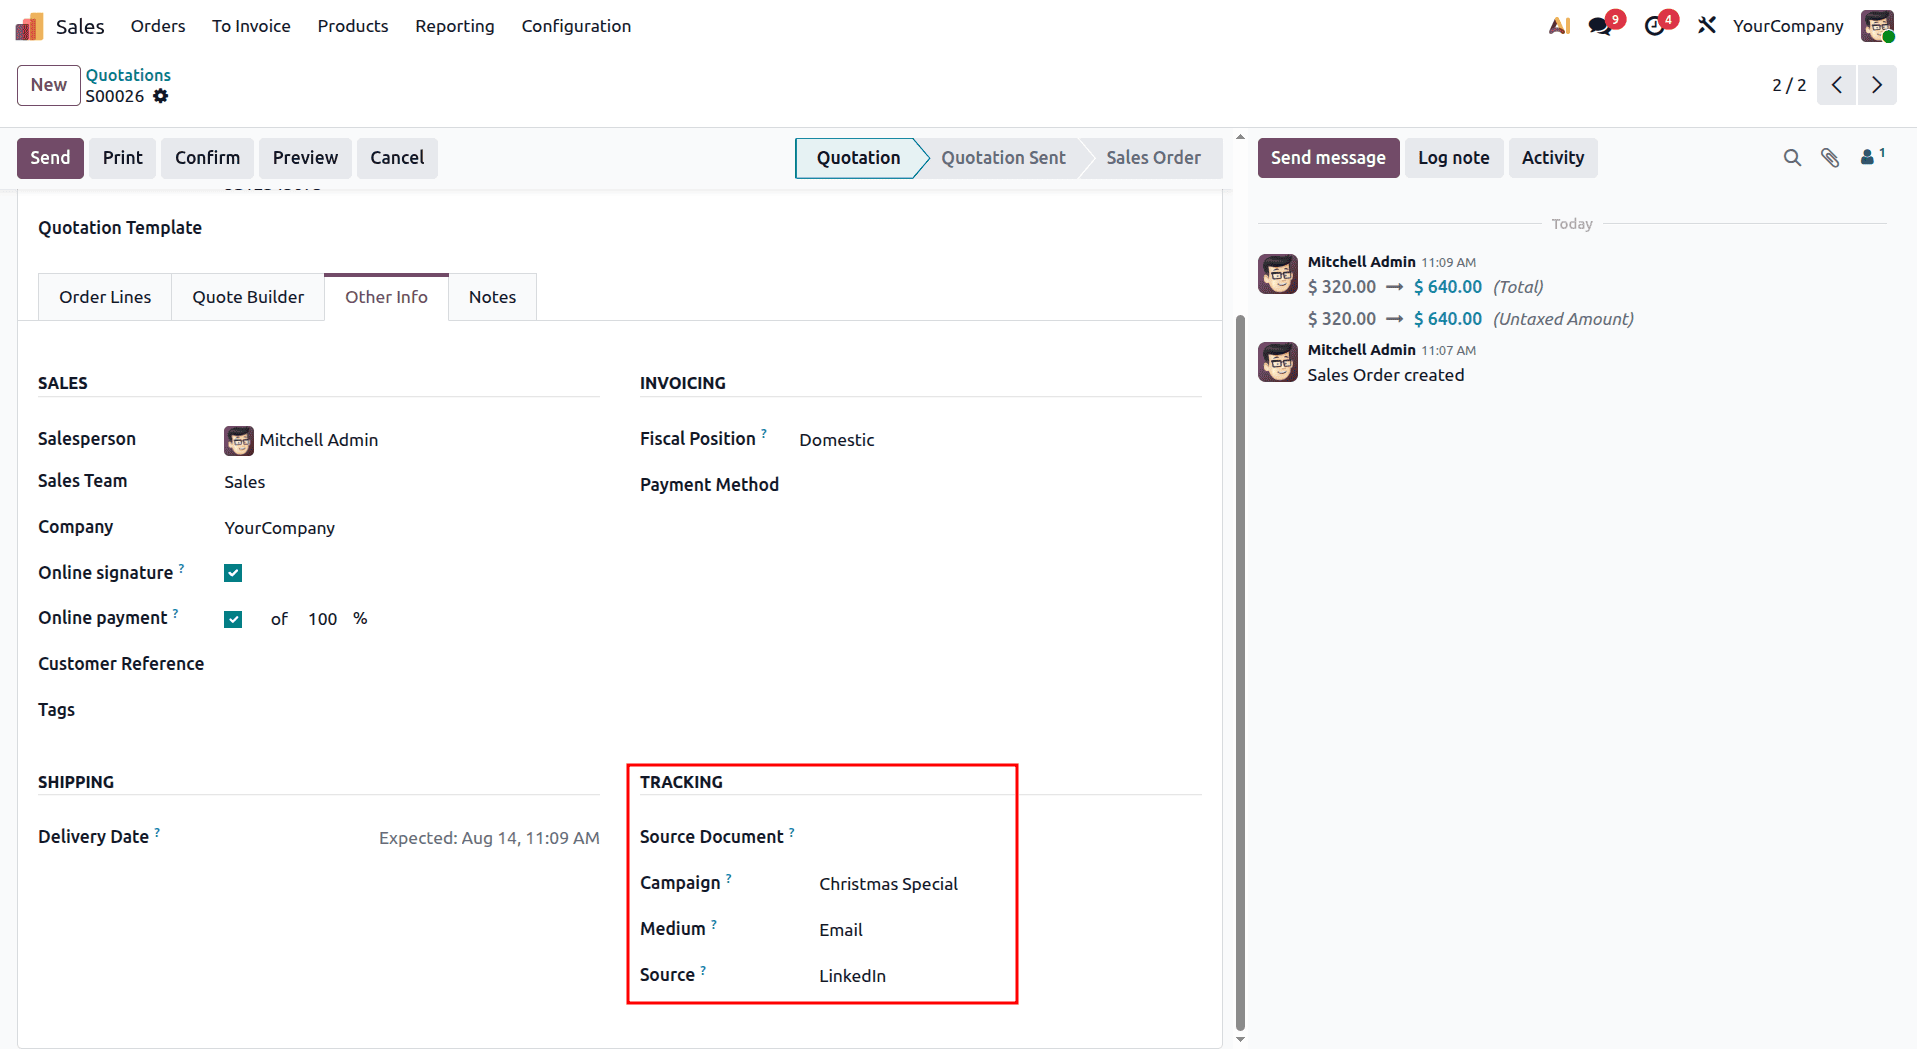
Return to the Dashboard module once again. Under the Top Sources and Top Media sections, you can see the newly added LinkedIn source and Email medium reflected in the analytics, as shown below. This demonstrates how the Dashboard automatically updates tracking data based on the information entered in the sales order.
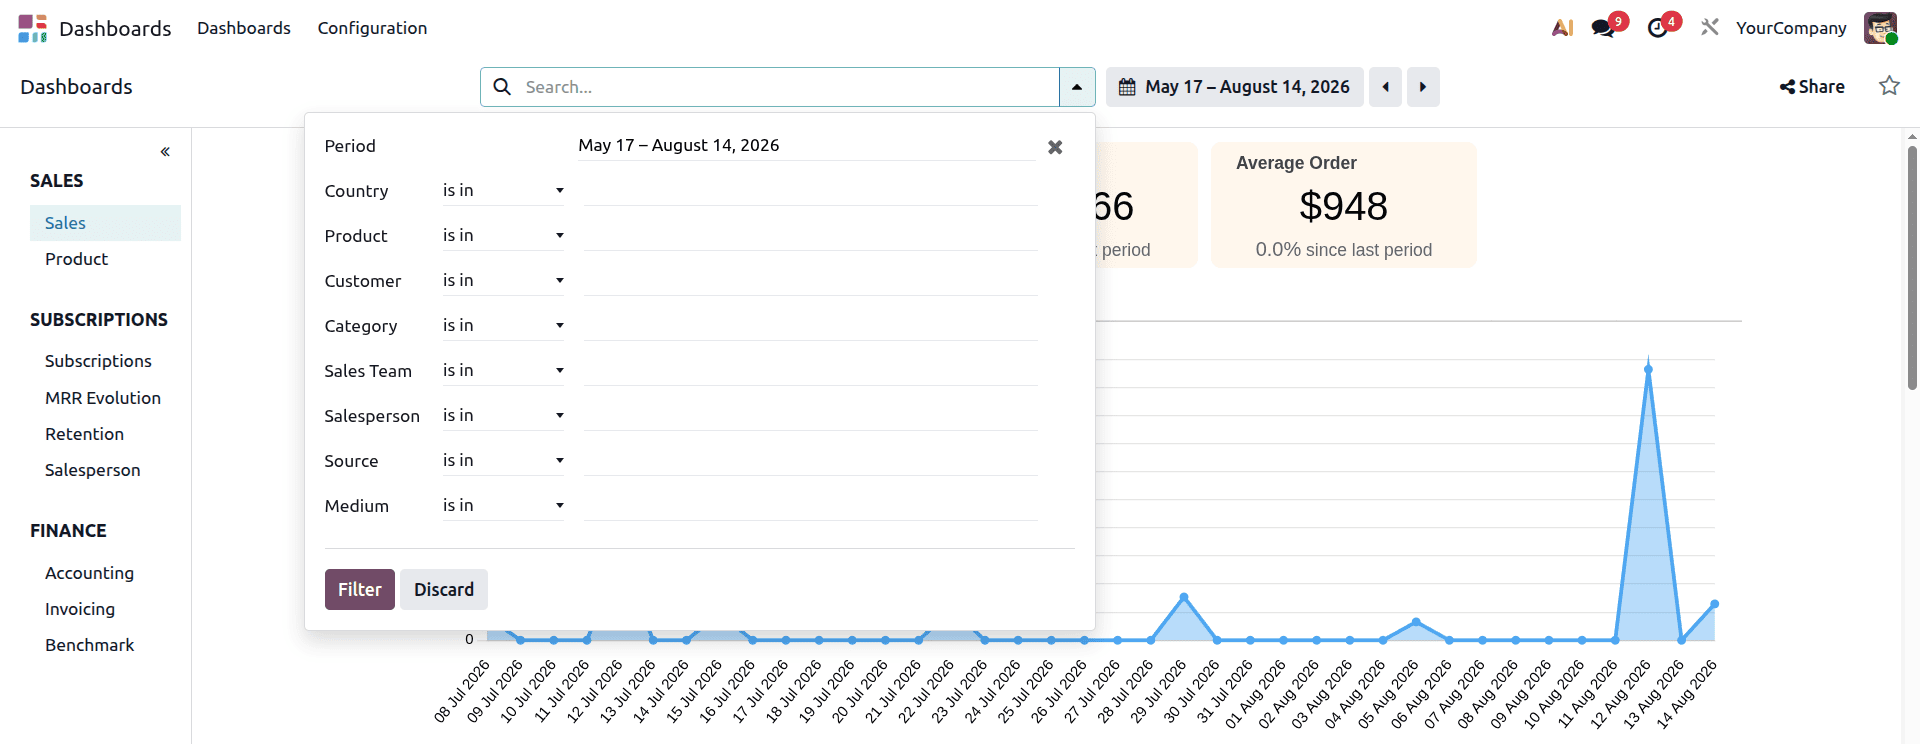
The Dashboard module also provides a variety of filtering options to help users analyze data more effectively. You can filter the displayed information by Period, Country, Product, Customer, Category, Sales Team, Salesperson, Source, and Medium. These filters enable users to focus on specific business metrics and gain deeper insights into sales performance.
1.2 Product
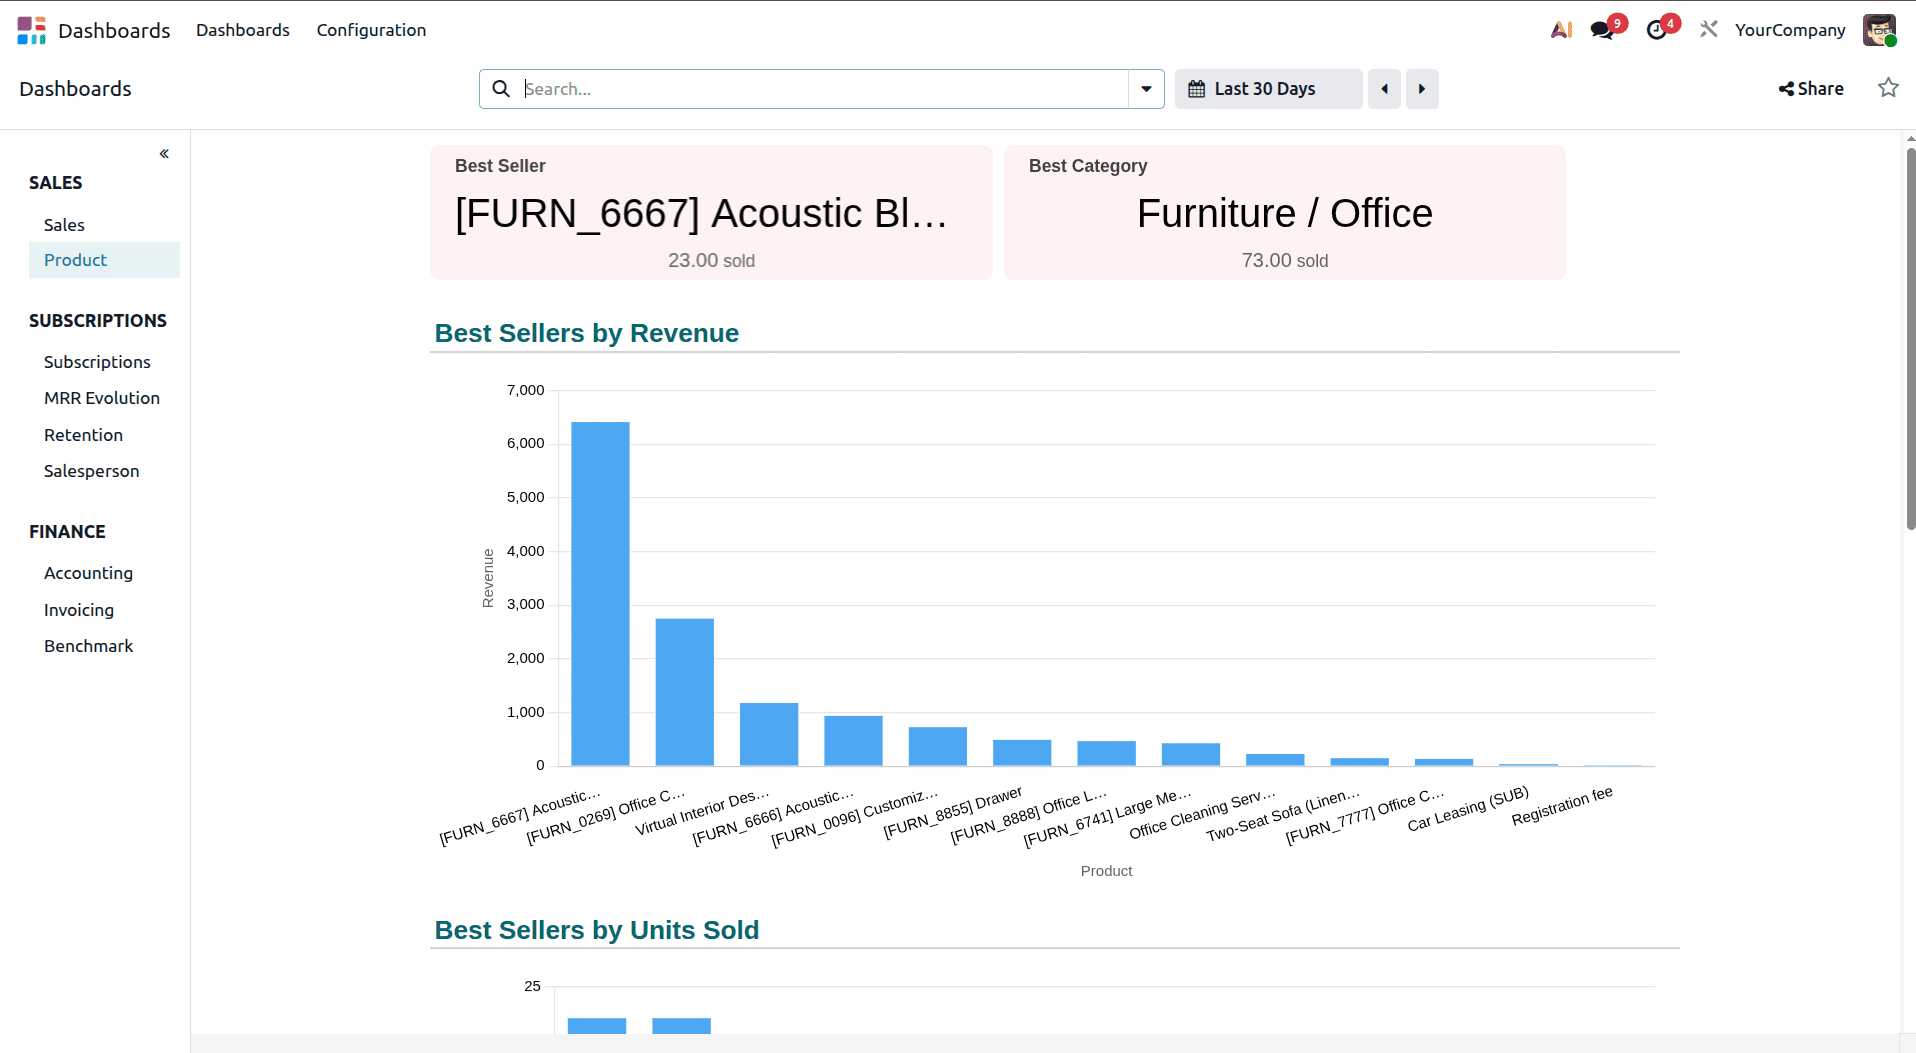
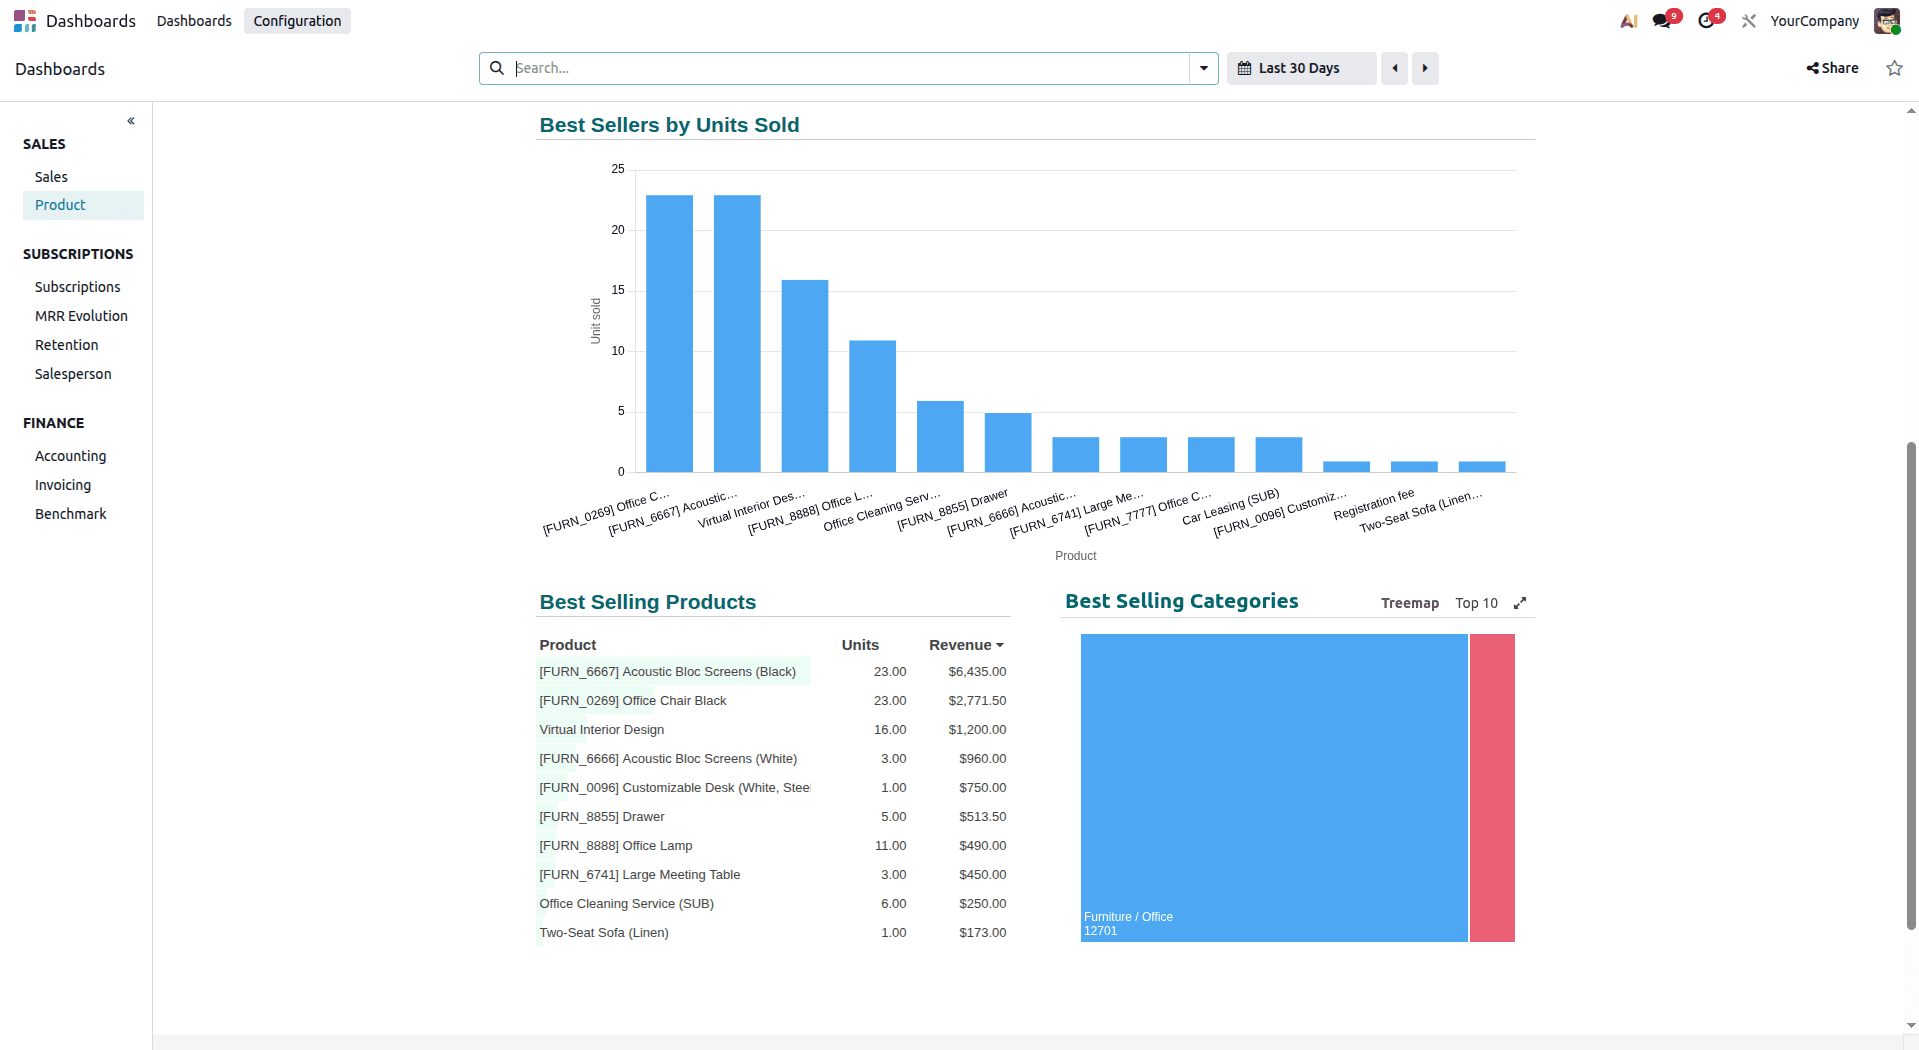
Click the Product option in the Dashboard to view product-related sales insights. This section highlights the Best-Selling Products and Top Product Categories, making it easy to identify the products and categories that generate the highest sales.
You can also analyze the Best Sellers by Revenue through an interactive graph, providing a clear visual representation of product performance, as shown below.
You can also analyze the Best-selling products, Best Selling Products, Best Selling Categories through an interactive graph, which provides a clear visual representation of product performance based on sales. This makes it easy to identify the top-performing products and compare their sales figures, as shown below.
1.3 Rentals
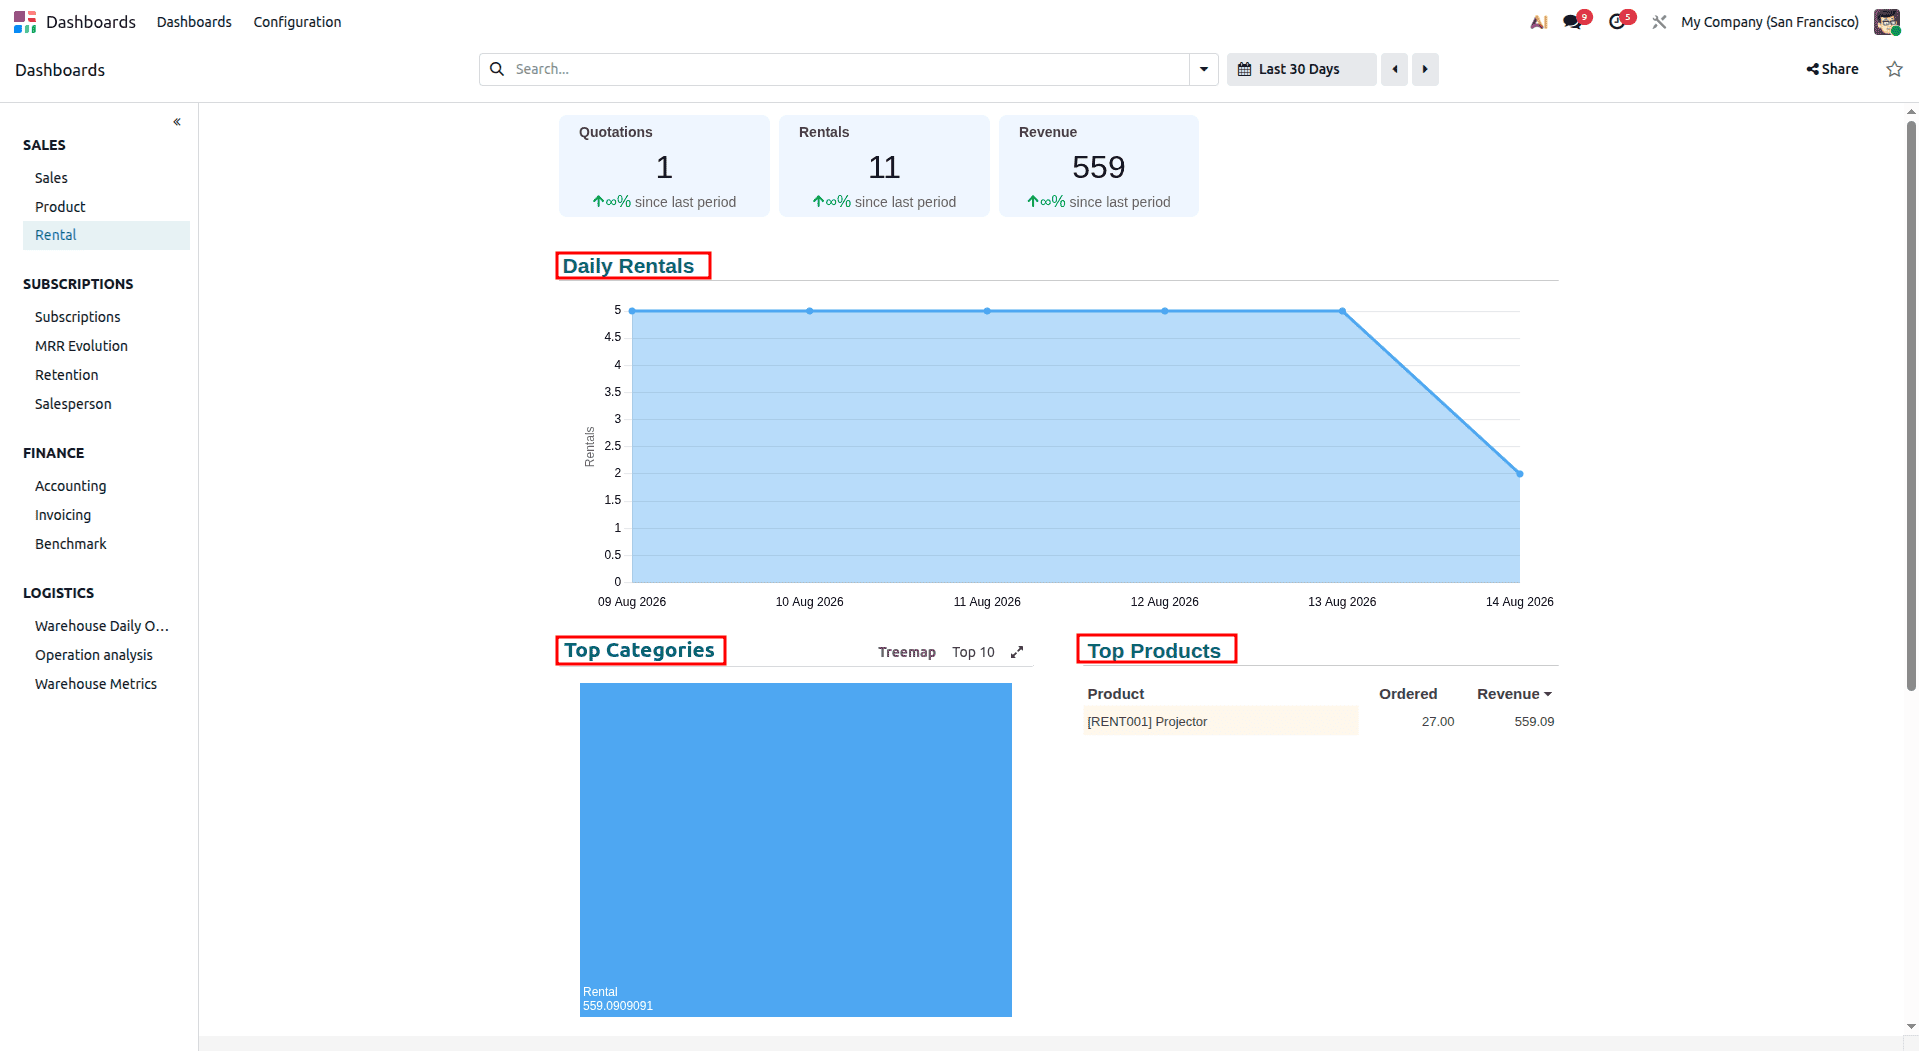
Go to the Sales menu under the Dashboard menu and select Rentals to analyze rental performance metrics. This particular dashboard shows the most important information, which includes the total Quotations, Rental Orders, and Revenue.
Graphical analysis of the daily number of rentals will give you a good idea about the rental process. Additionally, the Dashboard provides other useful statistics, including Top Product Categories, Top Products, Top Salespeople, and Top Customers.
2. Subscriptions
2.1 Subscriptions
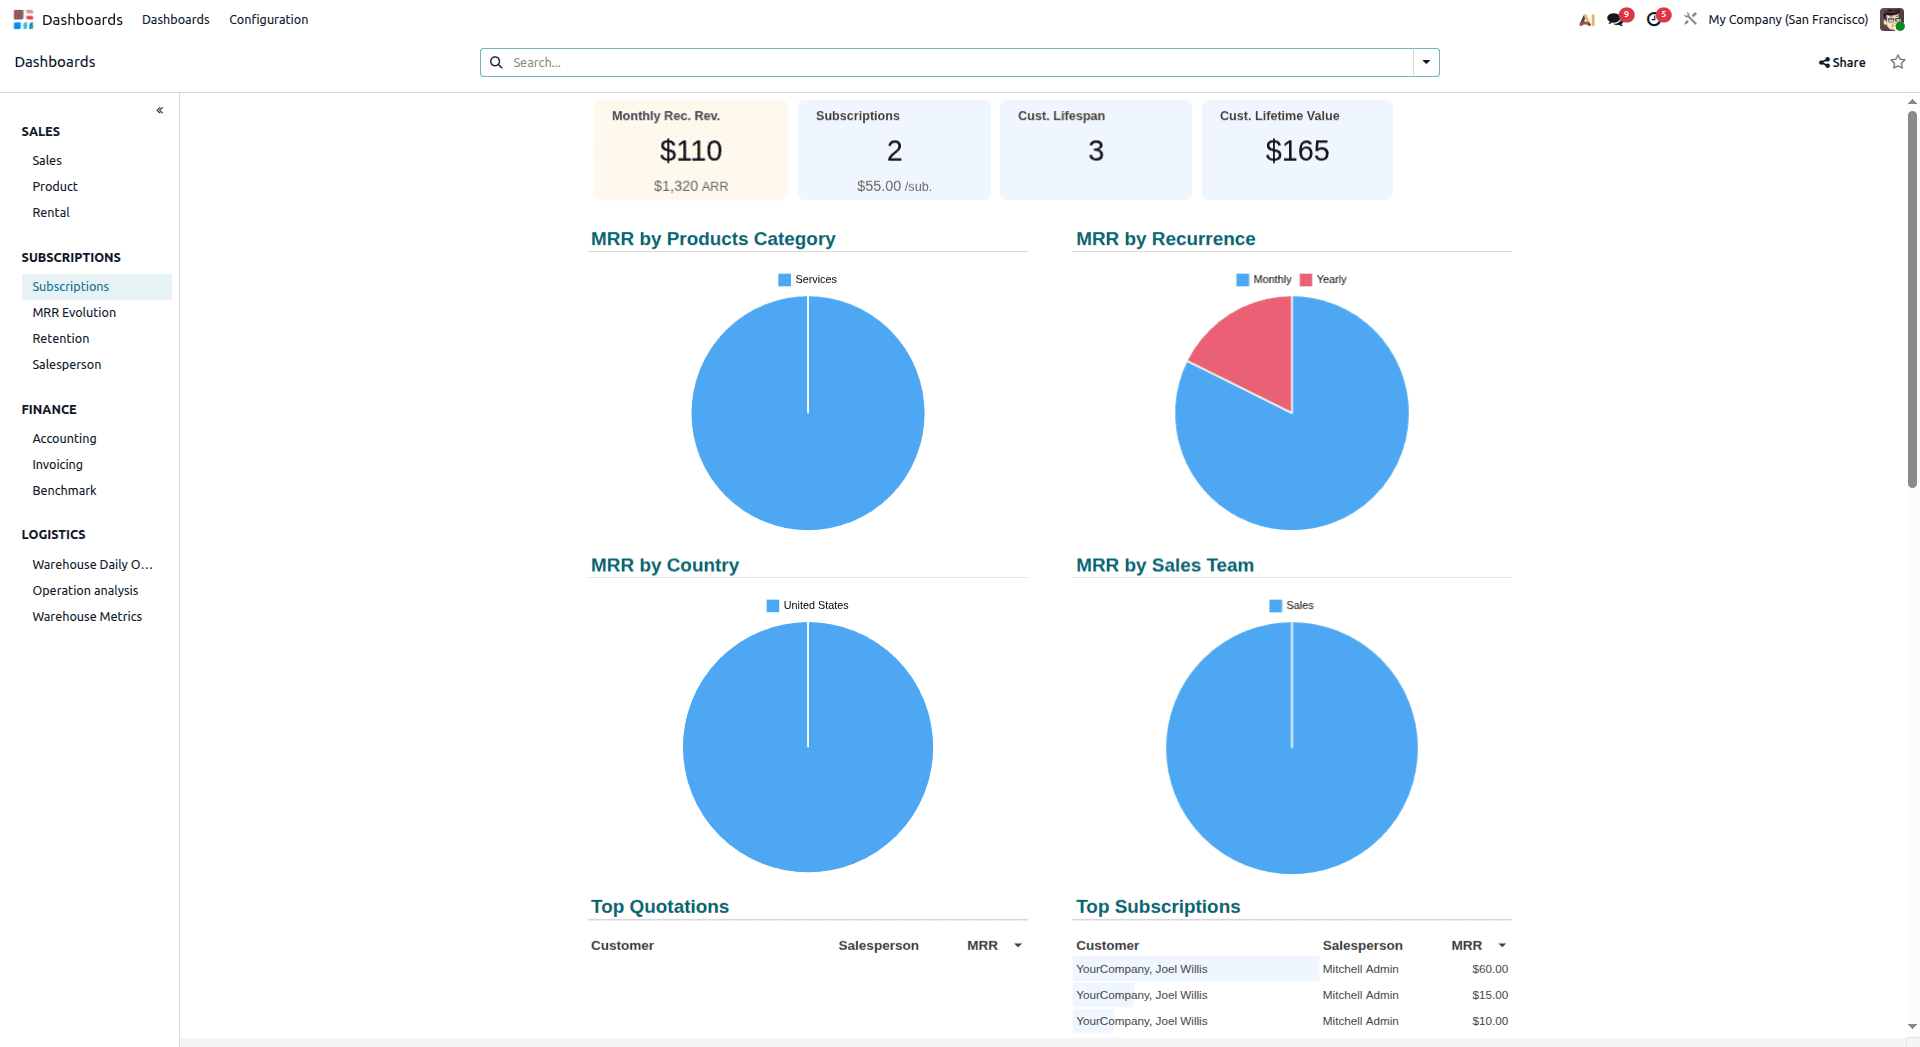
Under the Subscriptions section on the Dashboard, click on Subscriptions to see metrics related to subscriptions. Some of the KPIs displayed include Monthly Recurring Revenue (MRR), Total Subscriptions, Customer Lifespan, and Customer Lifetime Value (CLV) for businesses to be able to track the progress and performance of their subscription programmes.
The Dashboard offers additional pie charts that help to track MRR by Product Category and MRR by Recurrence.
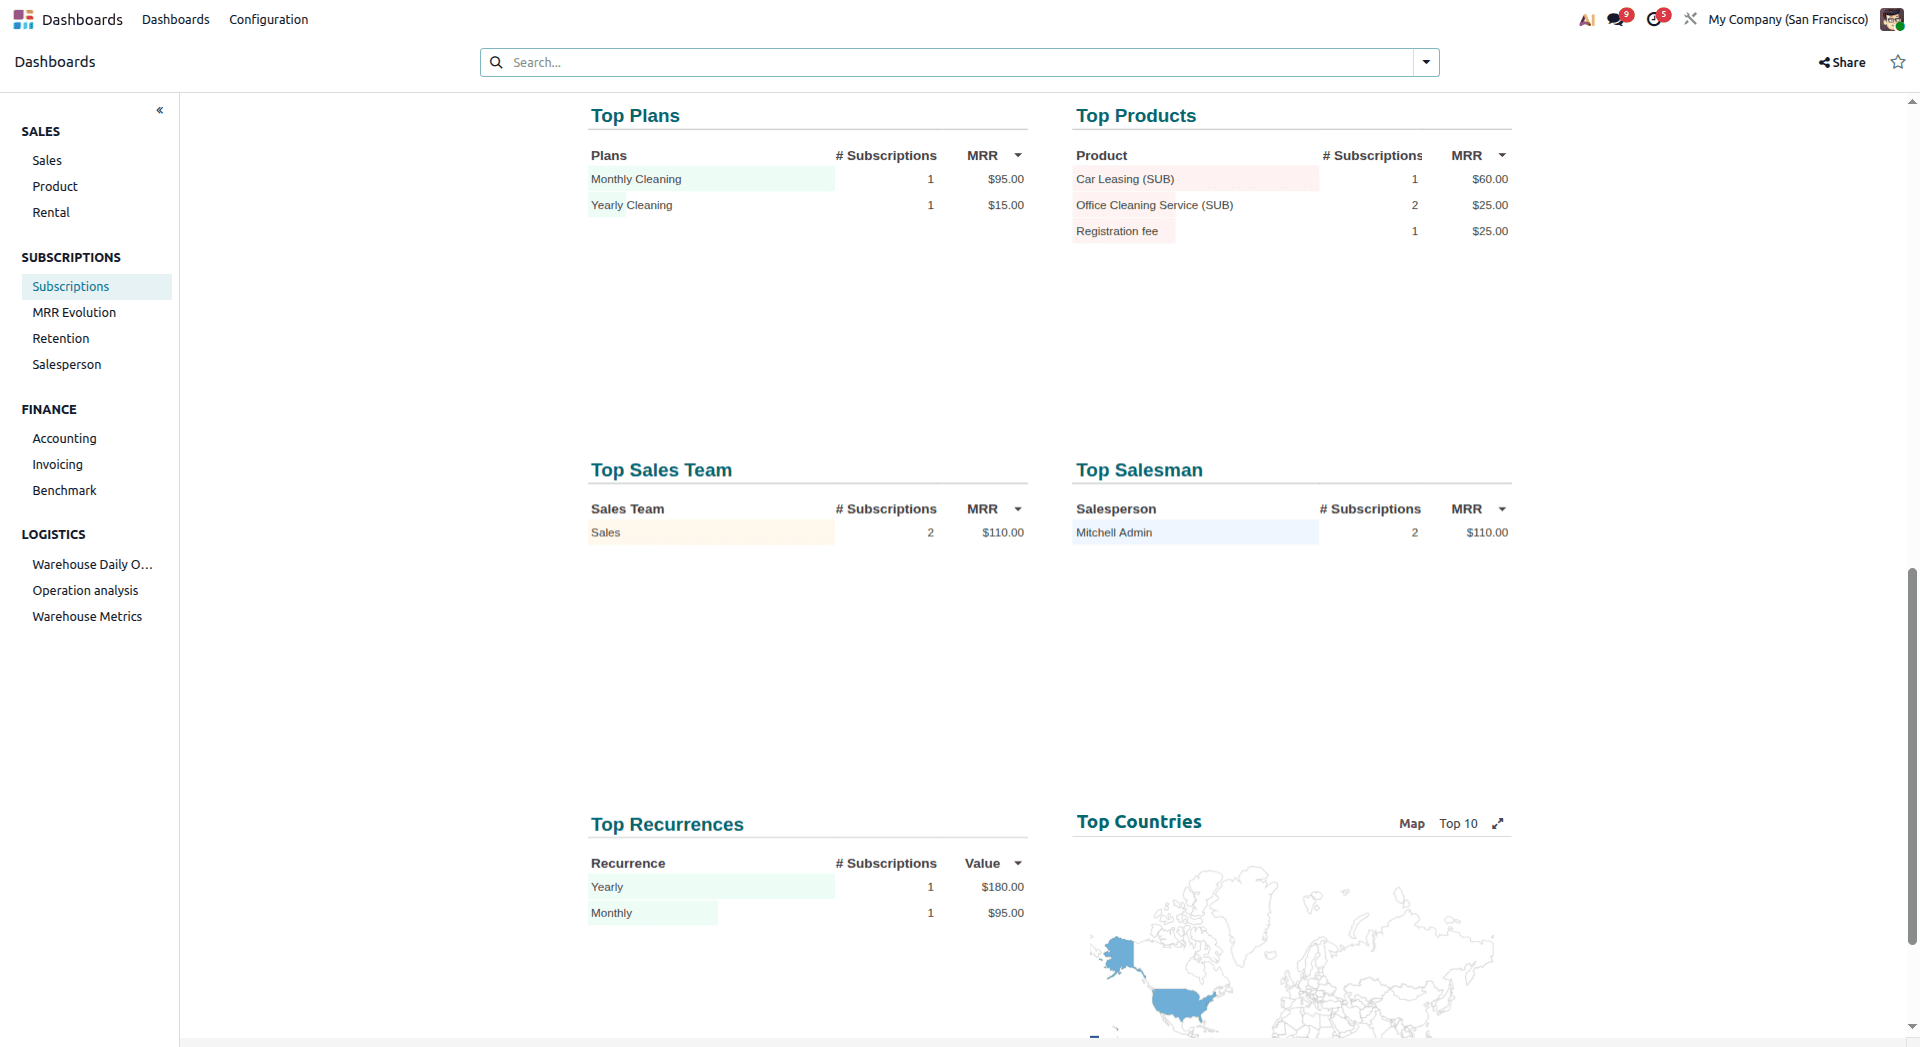
Furthermore, some of the valuable insights highlighted on the Dashboard include Top Plans, Top Products, Top Sales Teams, Top Salespeople, Top Recurrence Periods, and Top Countries, as seen below
2.2 MRR Evolution
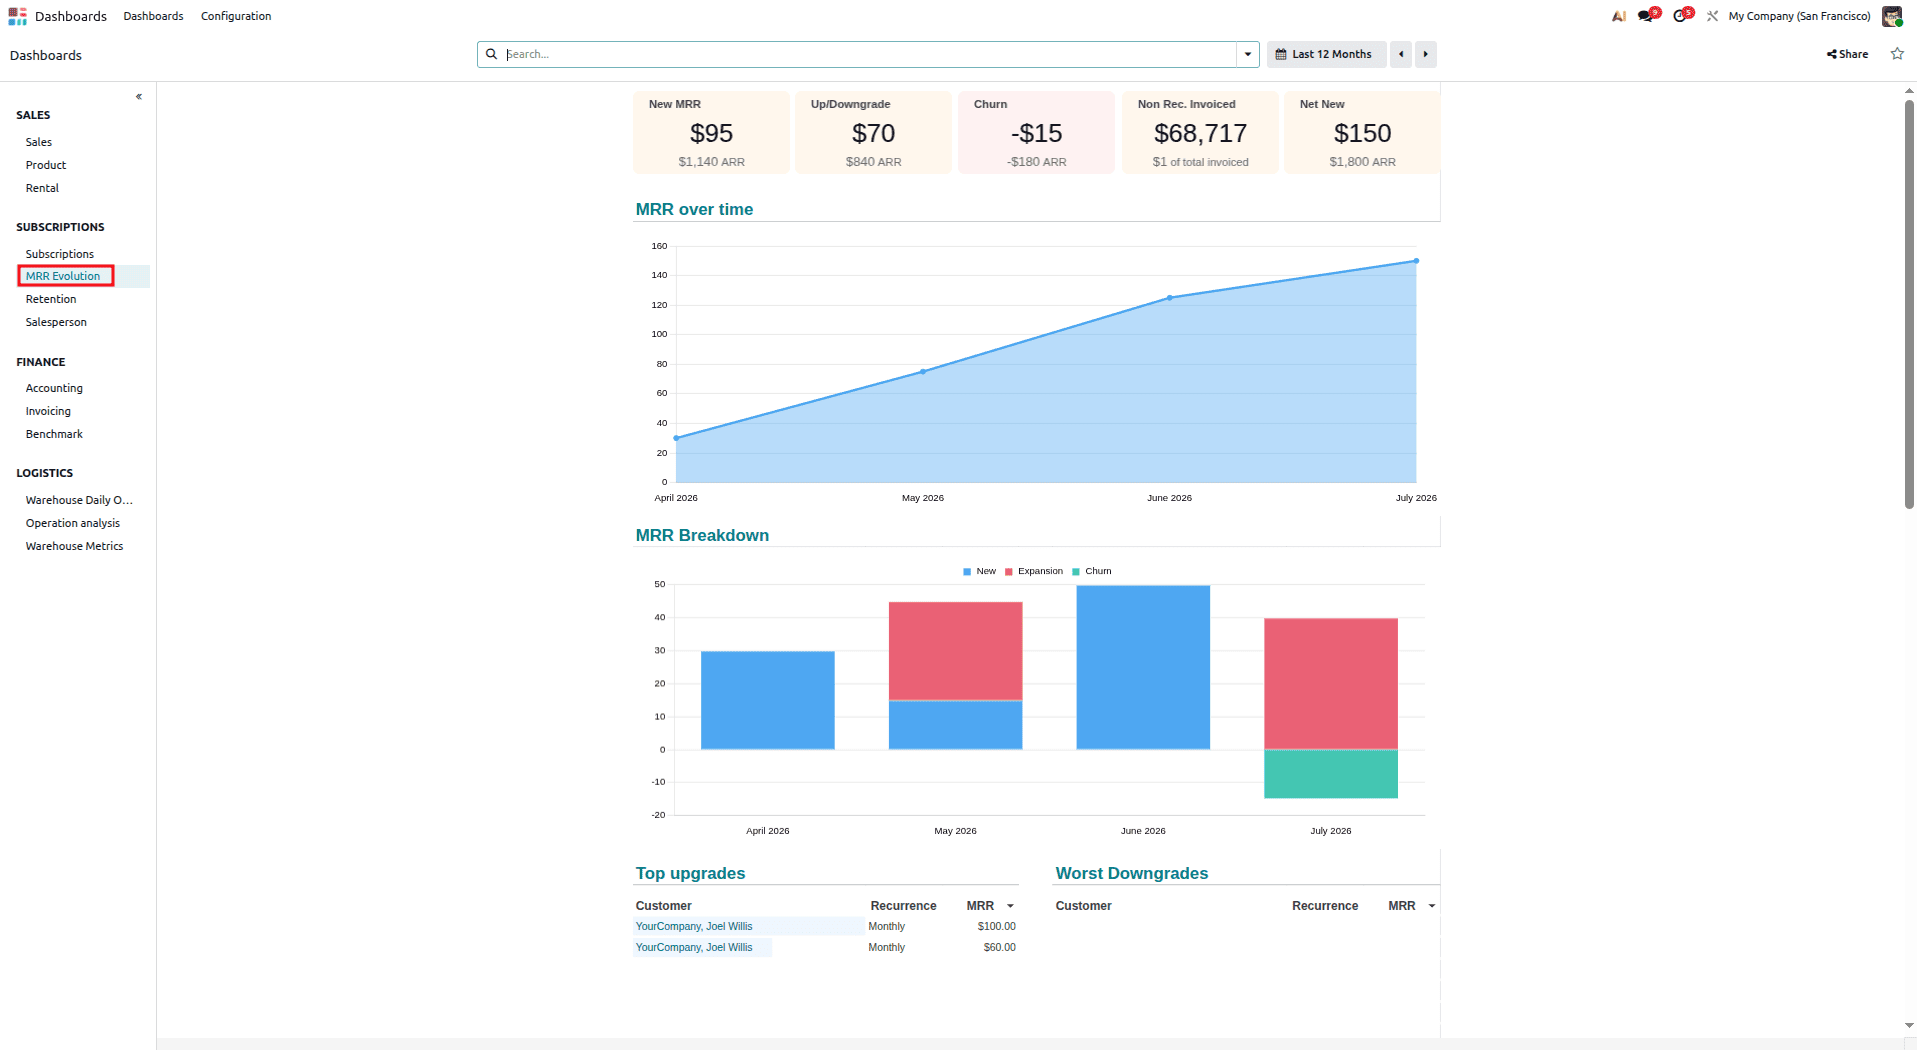
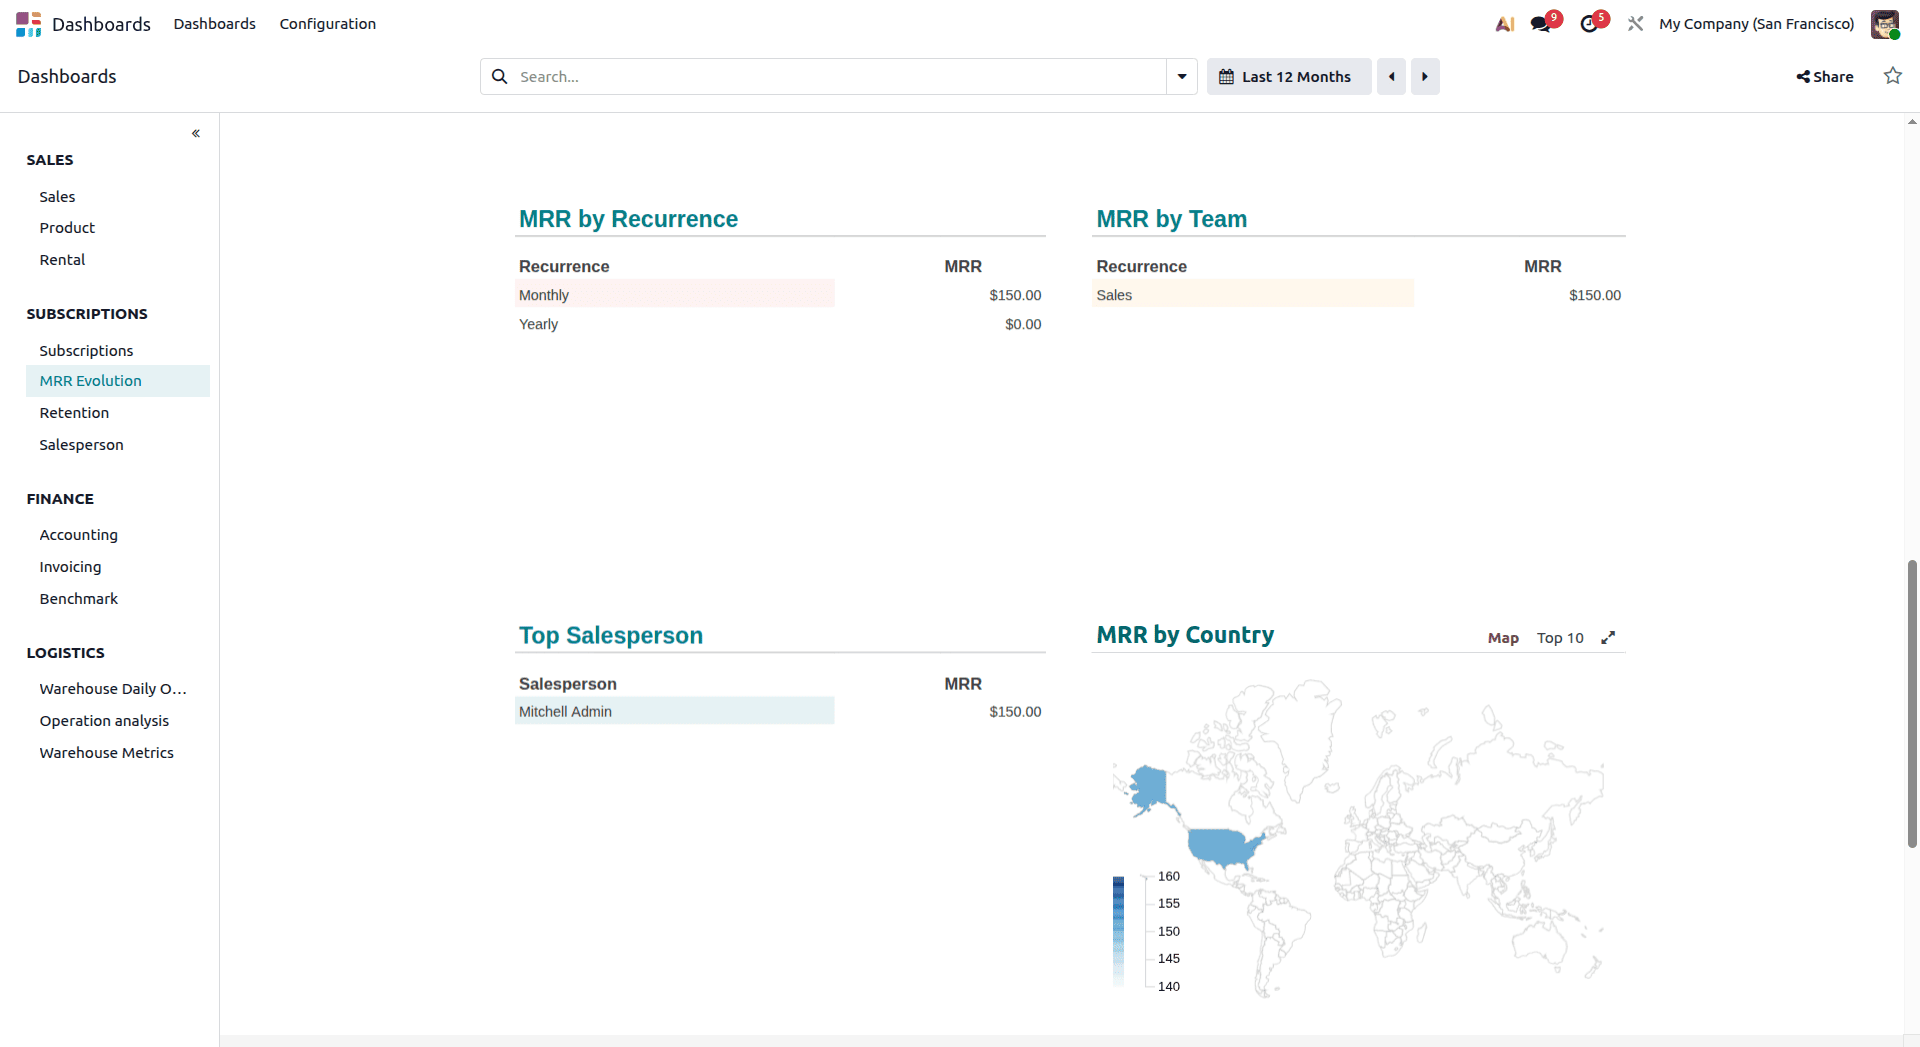
Select MRR Evolution from the Subscriptions section to gain detailed insights into the performance of your recurring revenue. This dashboard provides graphical analyses of Monthly Recurring Revenue (MRR) Over Time and an MRR Breakdown, allowing users to monitor revenue trends and understand the factors contributing to changes in recurring income.
In addition, the Dashboard displays valuable metrics such as Top Upgrades, Largest Downgrades, MRR by Recurrence, MRR by Sales Team, Top Salespeople, and MRR by Country. These insights help businesses evaluate subscription growth, identify revenue opportunities, and track the performance of subscription plans across different teams and regions, as shown below.
2.3 Retention
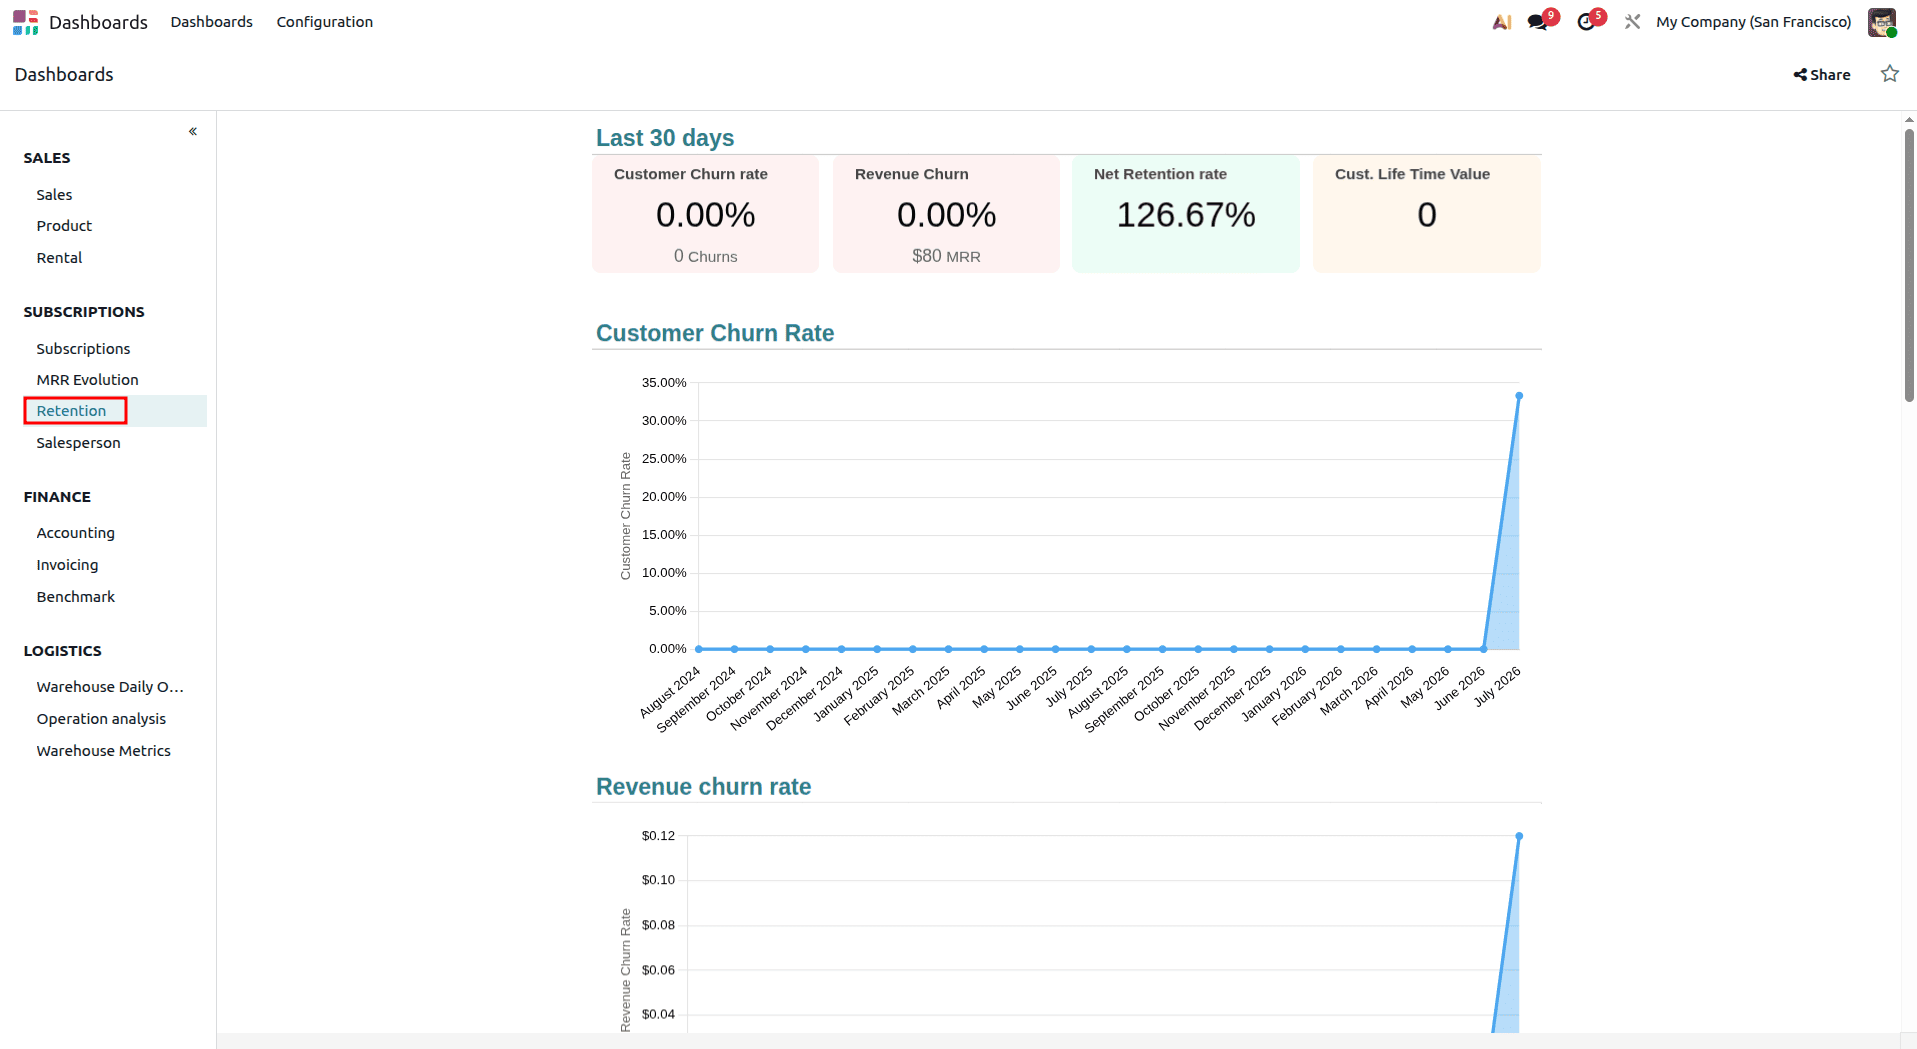
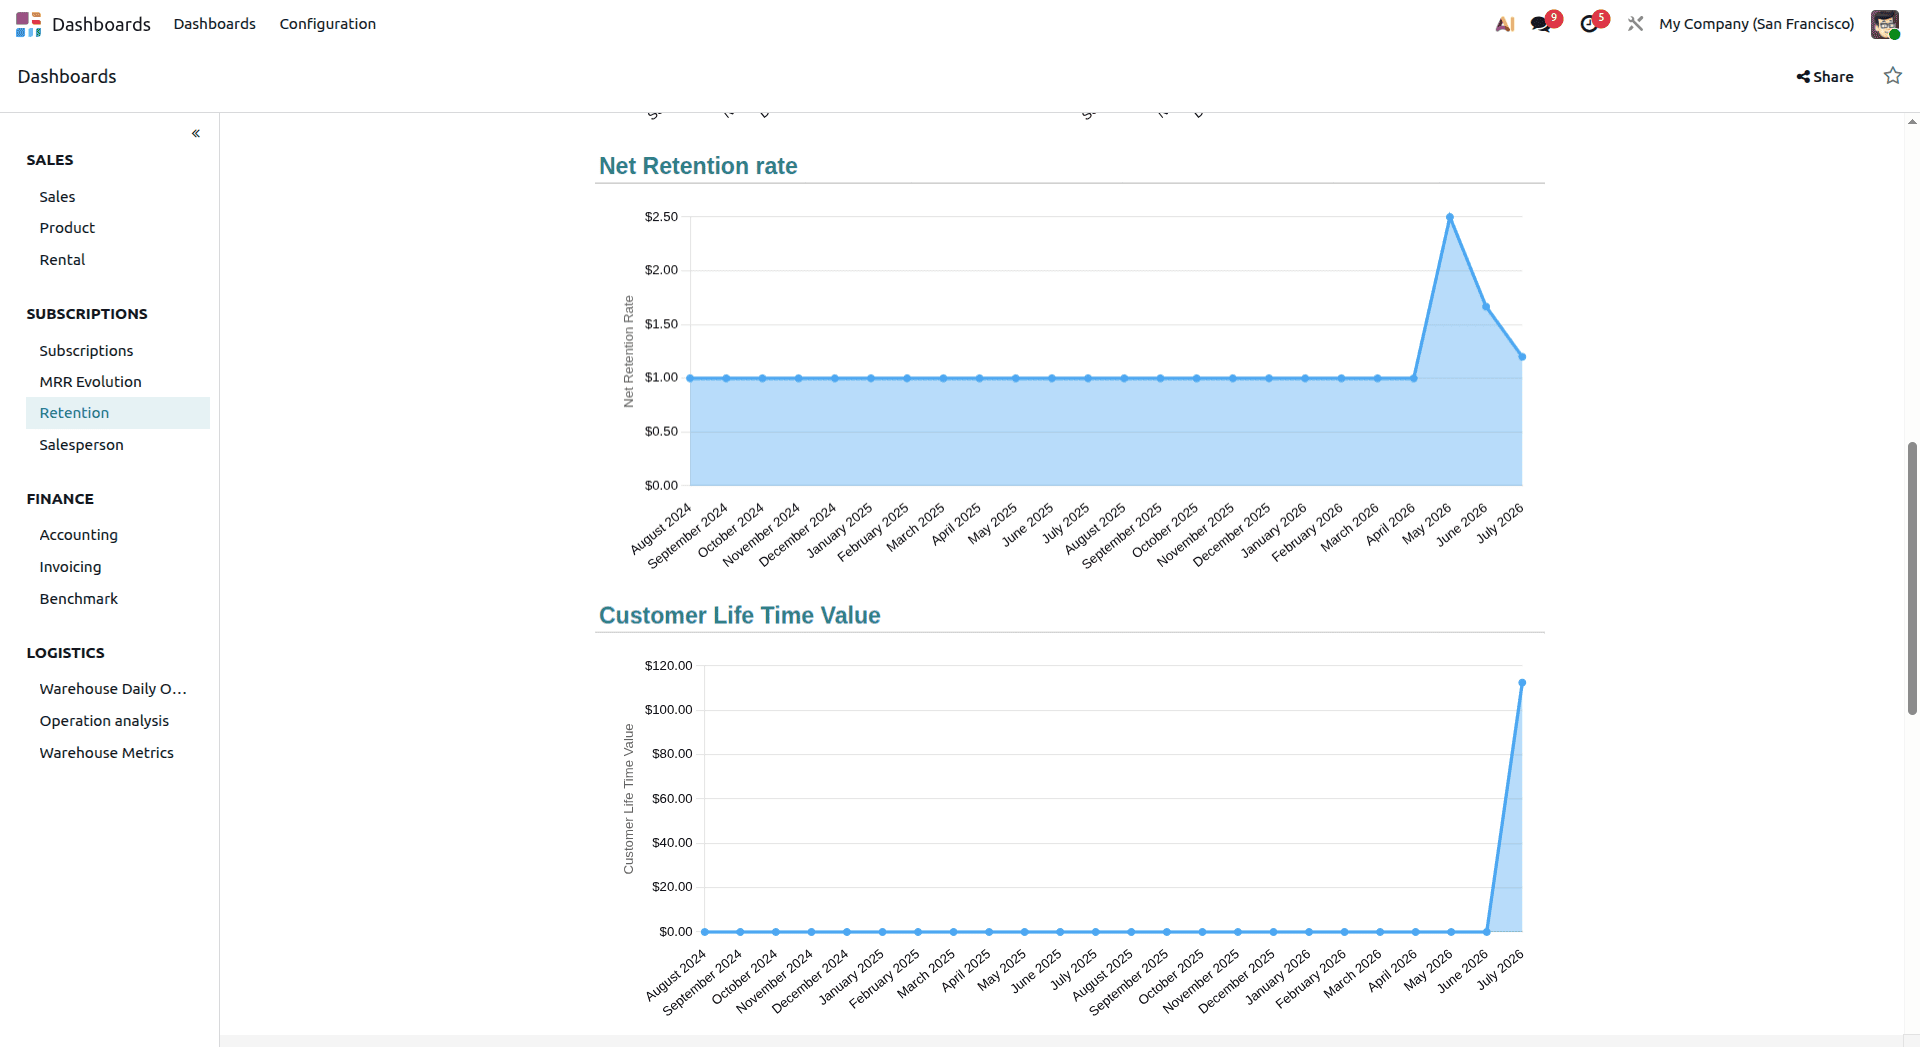
Select Retention from the Subscriptions section to analyze customer retention and subscription health. This dashboard displays key performance indicators, including the Customer Churn Rate, Revenue Churn Rate, Net Retention Rate, and Customer Lifetime Value (CLV).
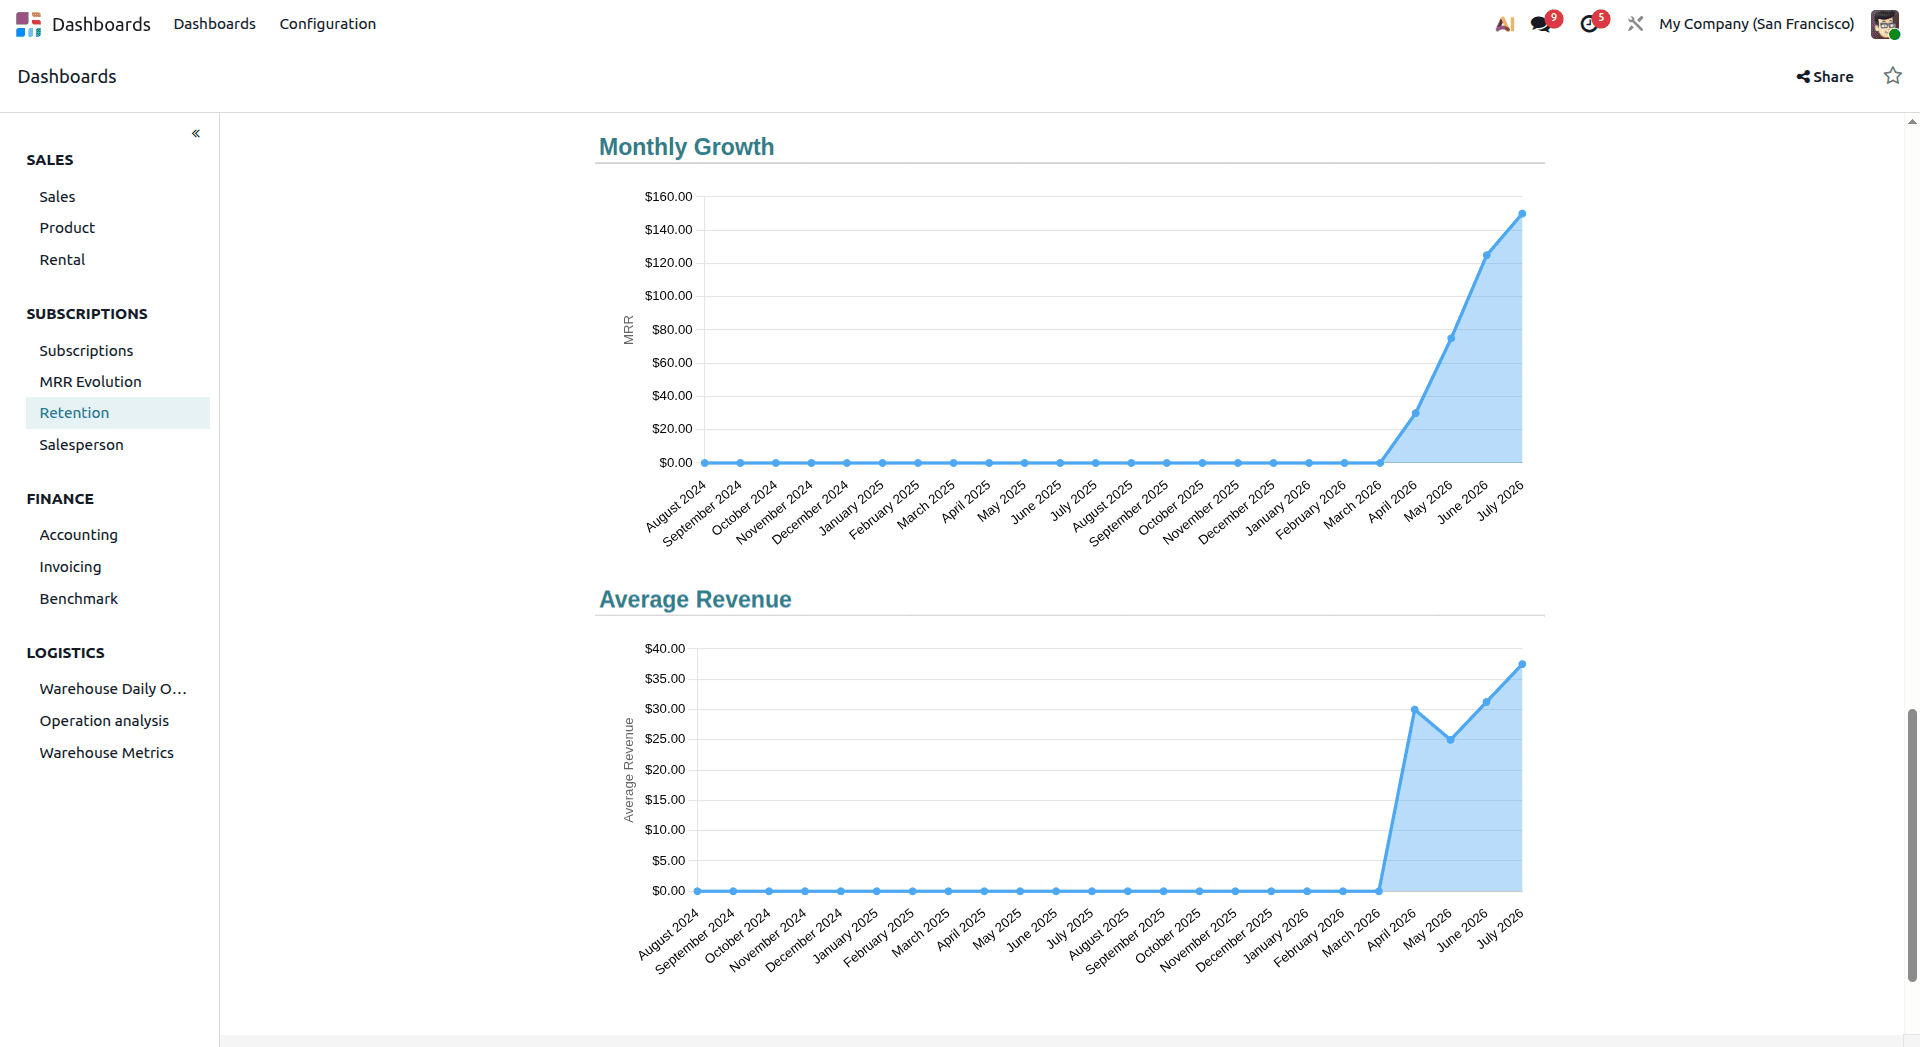
Interactive graphs provide a visual analysis of the Customer Churn Rate, Revenue Churn Rate, and Net Retention Rate over different years, making it easier to identify trends, evaluate customer retention, and measure the long-term performance of your subscription business.
2.4 Salesperson
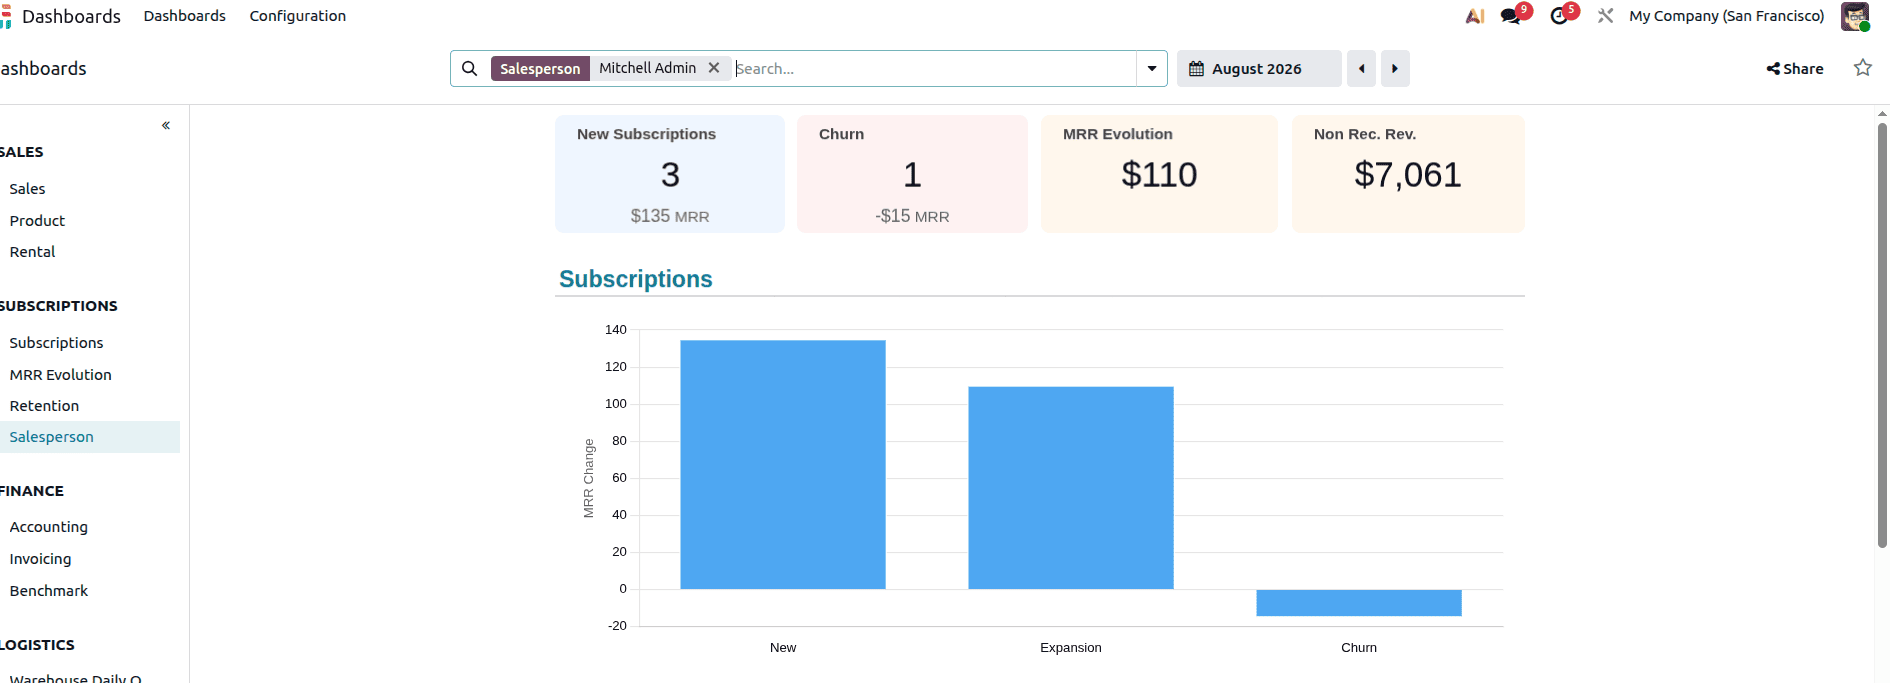
Select Salesperson under the Subscriptions section to analyze the performance of individual sales representatives. This dashboard provides key metrics such as New Subscriptions, Churn, and MRR Evolution, helping users monitor subscription growth and revenue performance for each salesperson.
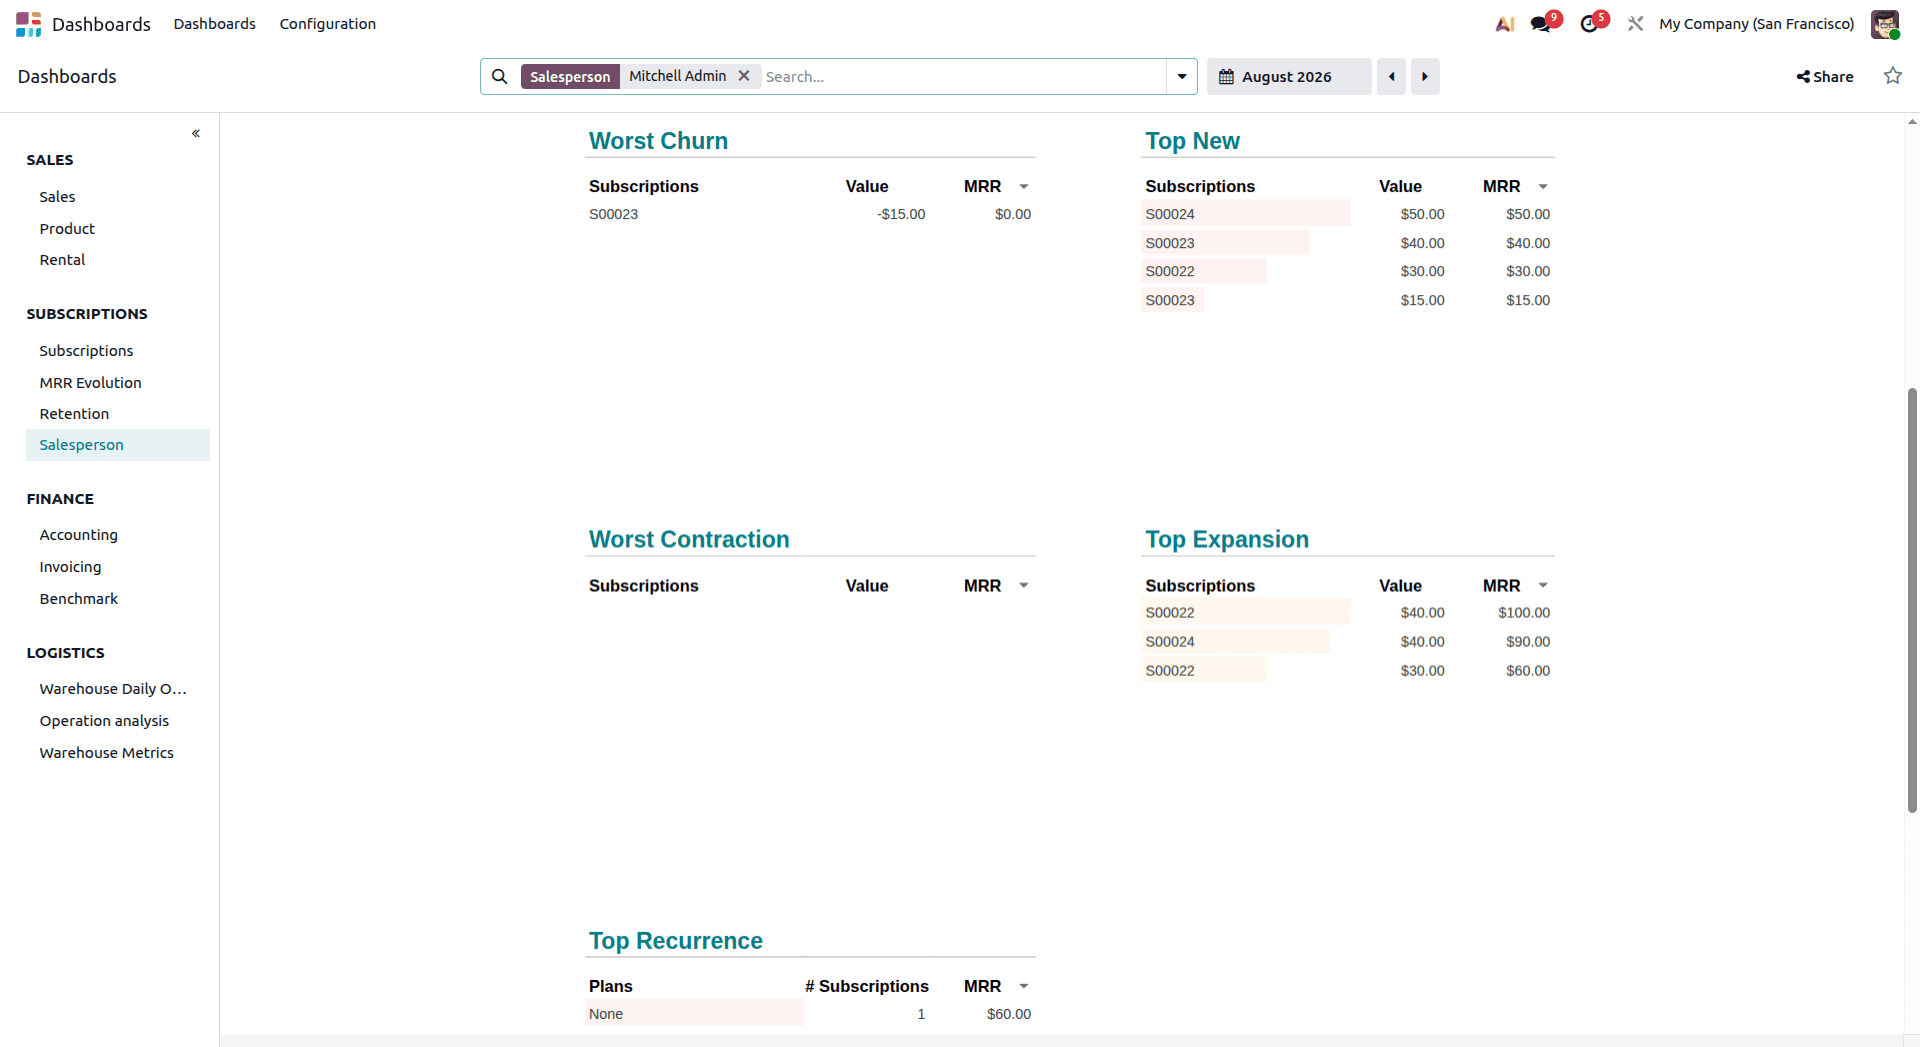
The dashboard also features interactive graphs for visualizing subscription activities over time. In addition, it highlights important insights, including Worst Churn, Top New Subscriptions, Worst Contractions, Top Expansions, and Top Recurrence Periods, enabling businesses to identify top-performing salespeople and areas that require attention.
3. CRM
3.1 Leads
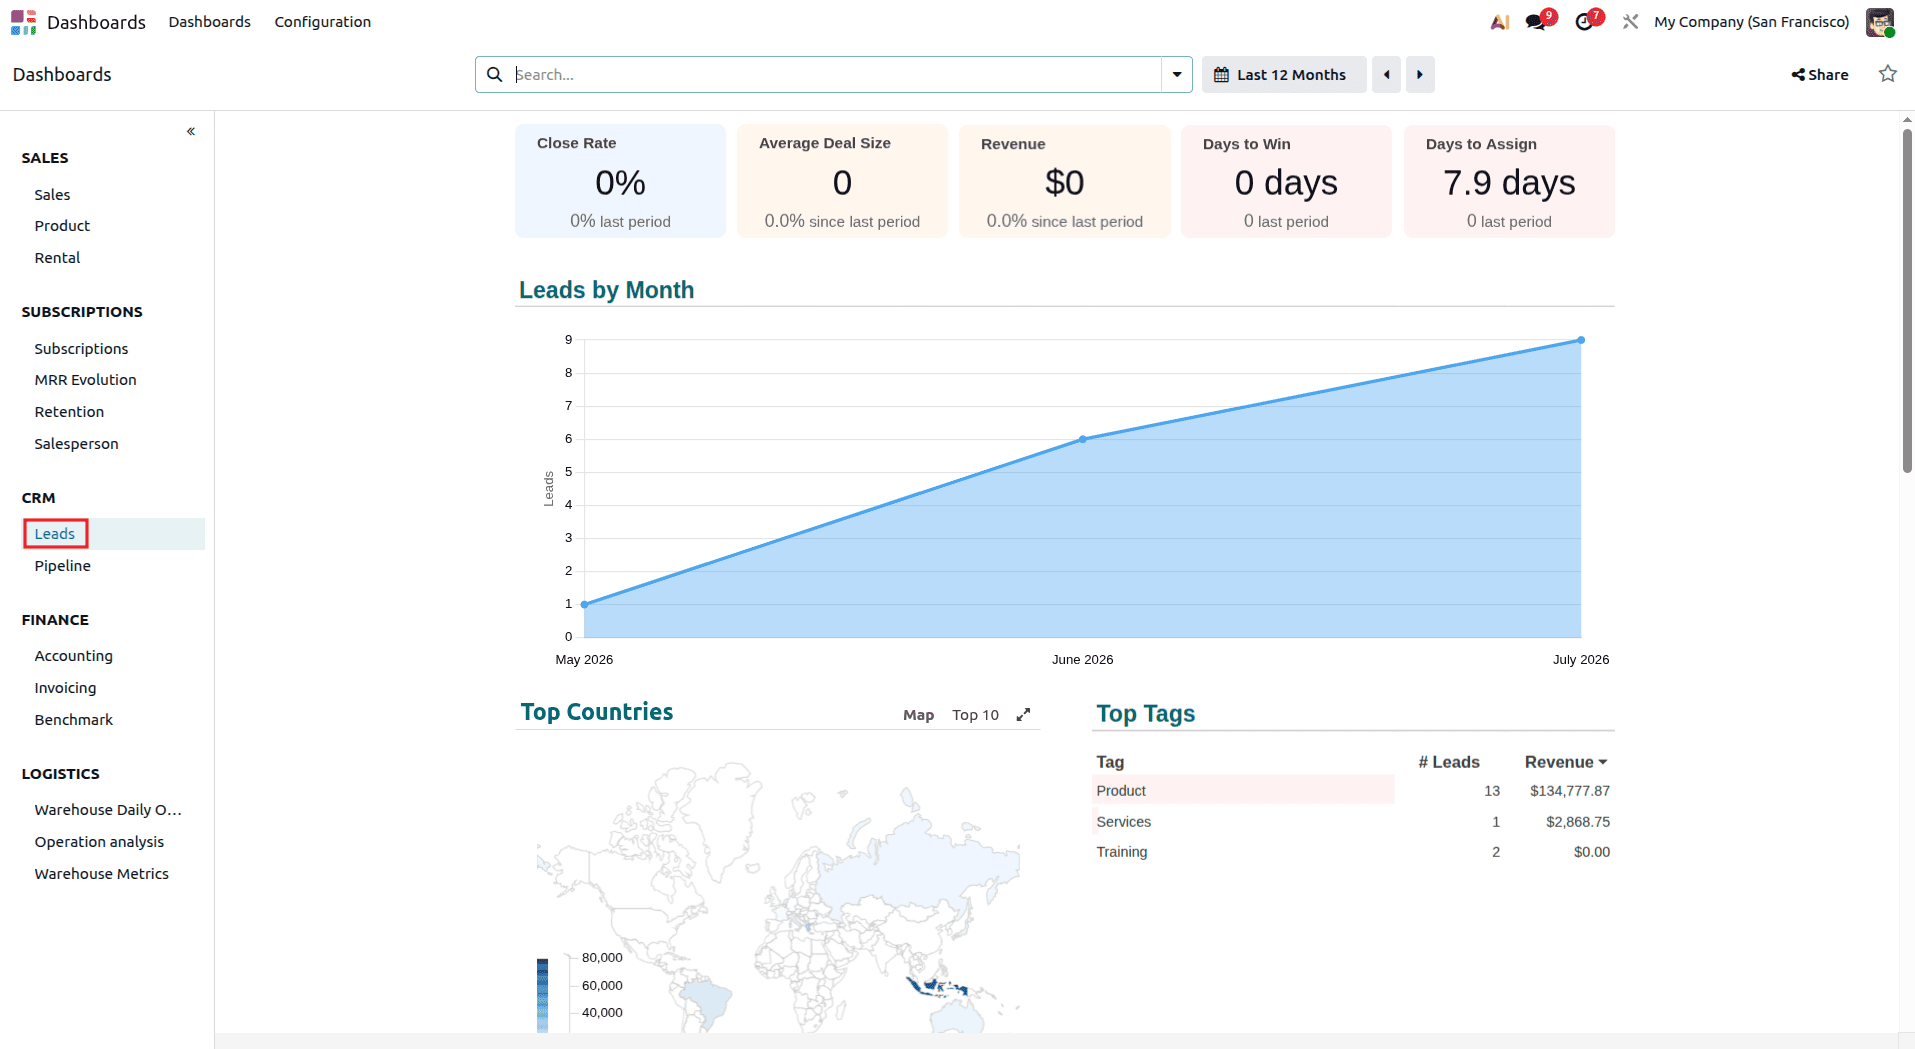
Select Leads from the CRM section of the Dashboard to access key lead management and sales performance metrics. This dashboard provides valuable insights, including the Close Rate, Average Deal Size, Revenue, Average Days to Win, and Average Days to Assign, helping users evaluate the effectiveness of their sales process.
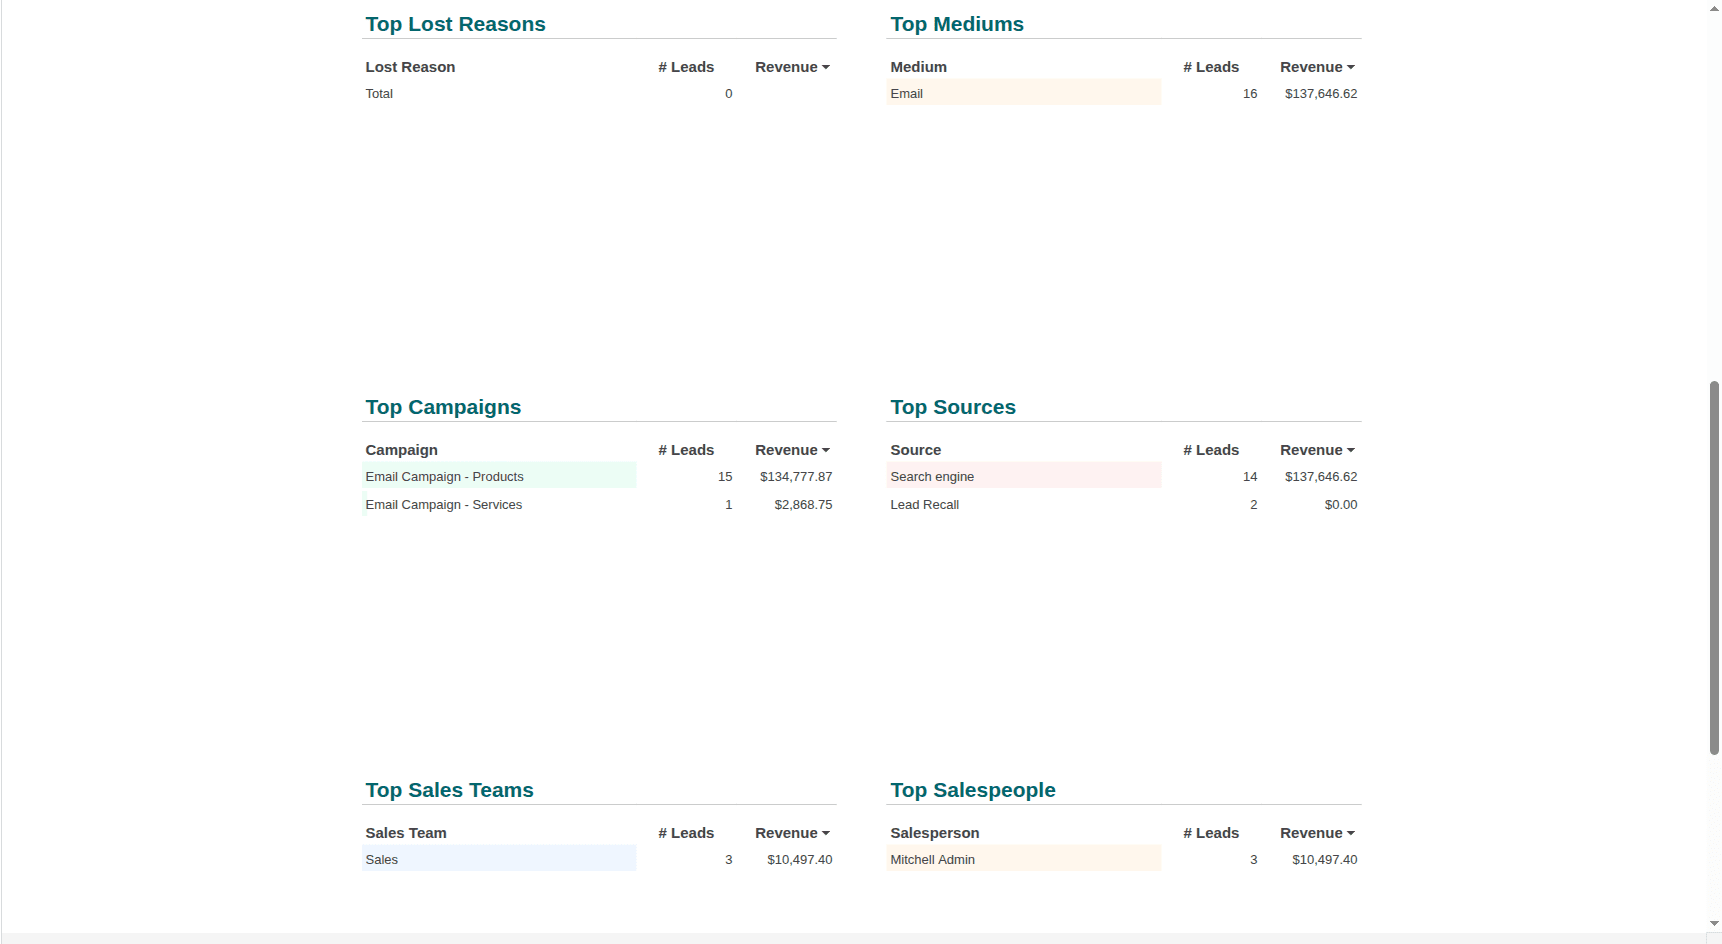
Additionally, the Dashboard provides detailed analytics, including Top Countries, Top Tags, Top Lost Reasons, Top Media, Top Campaigns, Top Sources, Top Sales Teams, and Top Salespeople. These insights enable businesses to identify successful lead sources, understand sales trends, analyze lost opportunities, and measure the performance of sales teams and individual representatives.
3.2 Pipeline
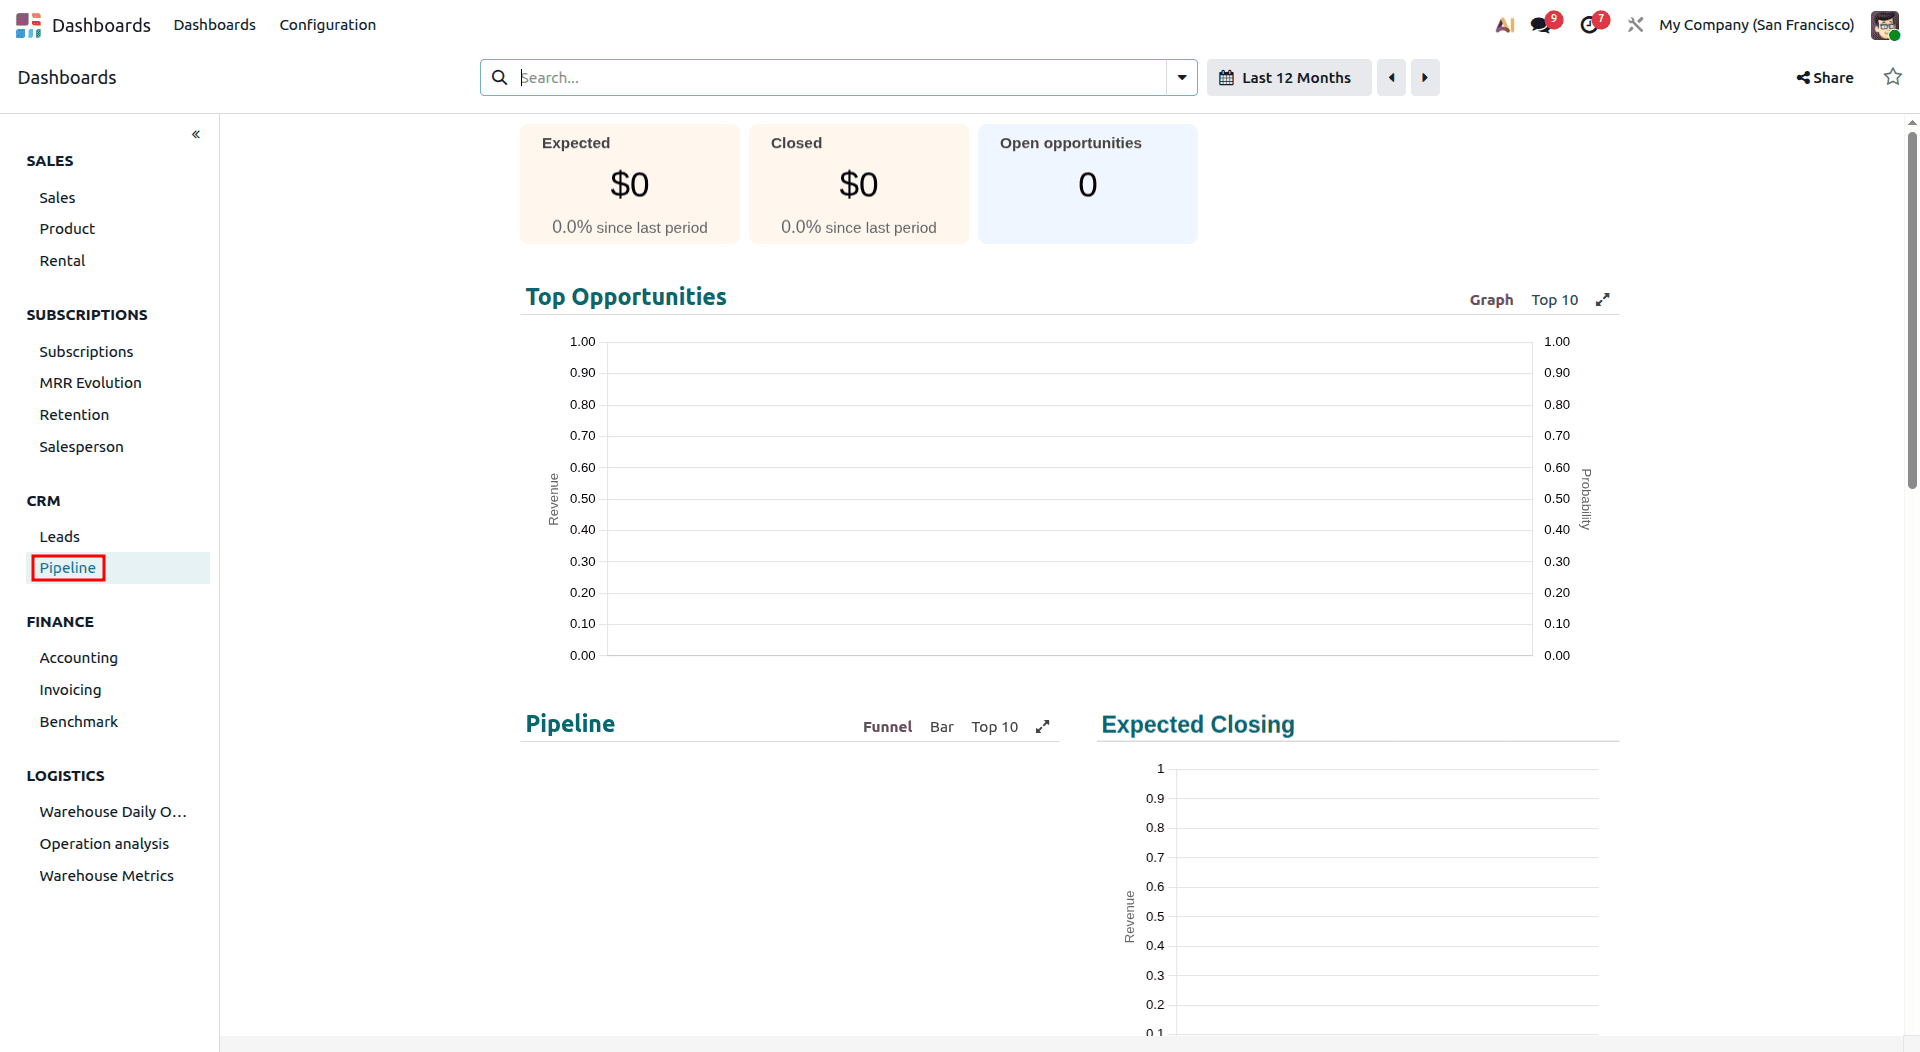
Select Pipeline under the CRM section to get a comprehensive overview of your sales pipeline. This dashboard displays key metrics such as the Expected Amount, Closed Amount, and the number of Open Opportunities, helping users monitor the progress and value of ongoing sales activities.
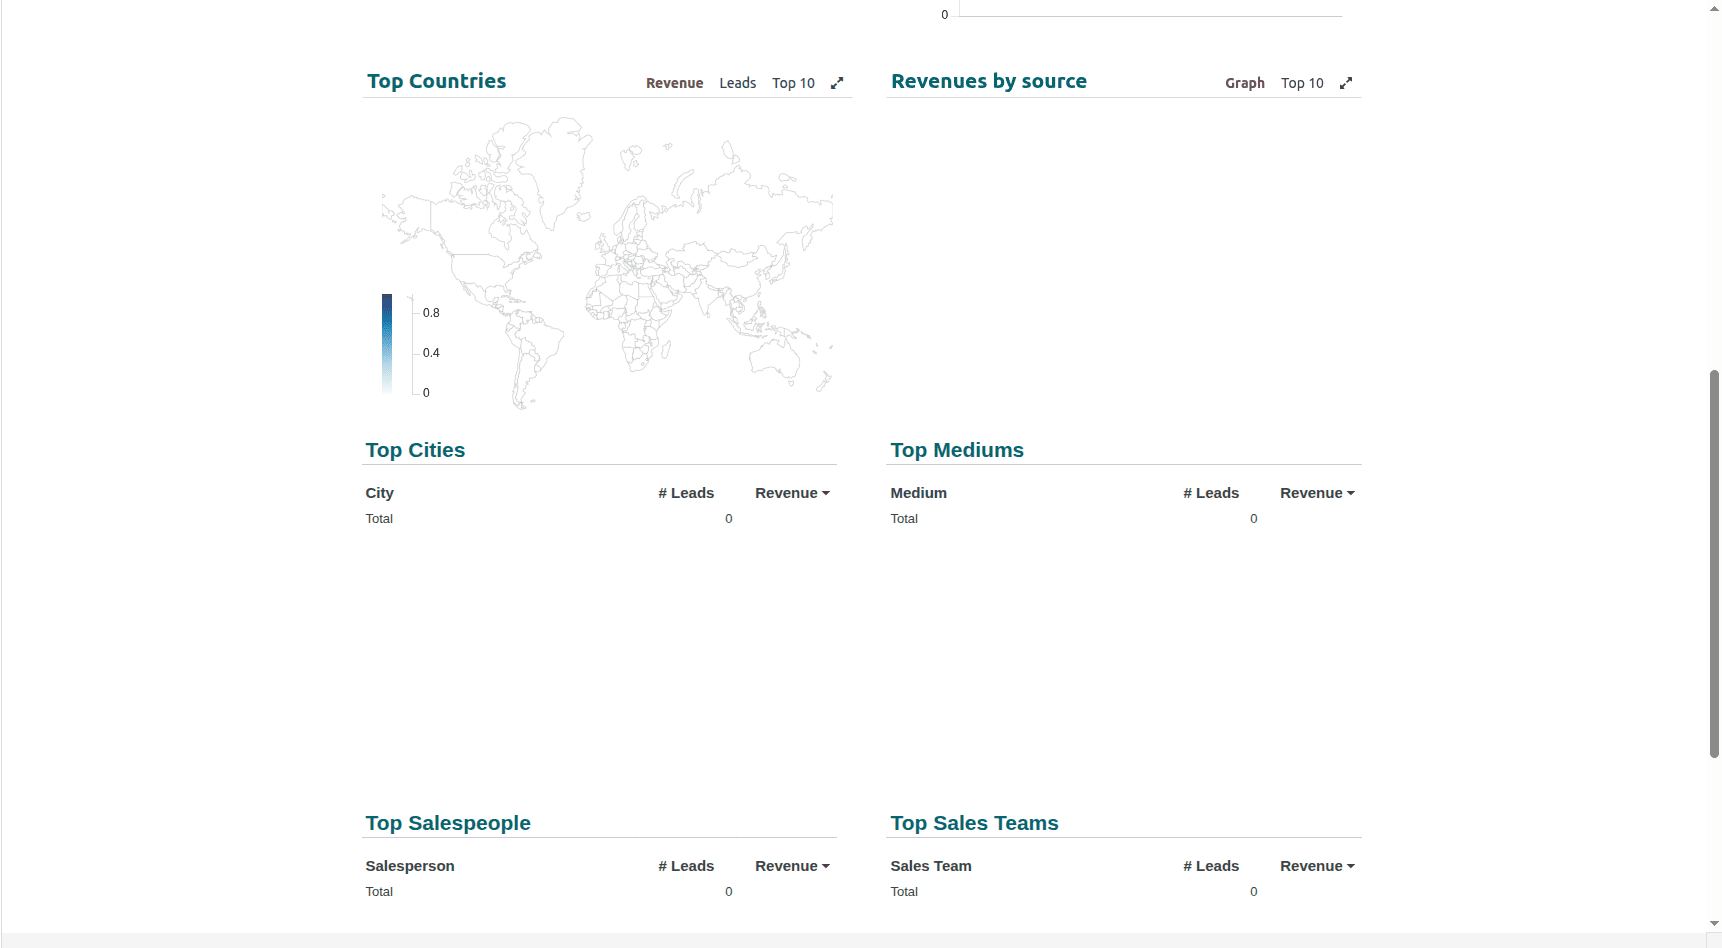
It also provides detailed insights into the Top Opportunities, Top Salespeople, Top Sales Teams, Top Countries, Top Cities, Top Media, and Top Sources. These analytics help businesses evaluate pipeline performance, identify high-value opportunities, and measure the effectiveness of sales teams and lead generation channels.
4. Finance
4.1 Accounting
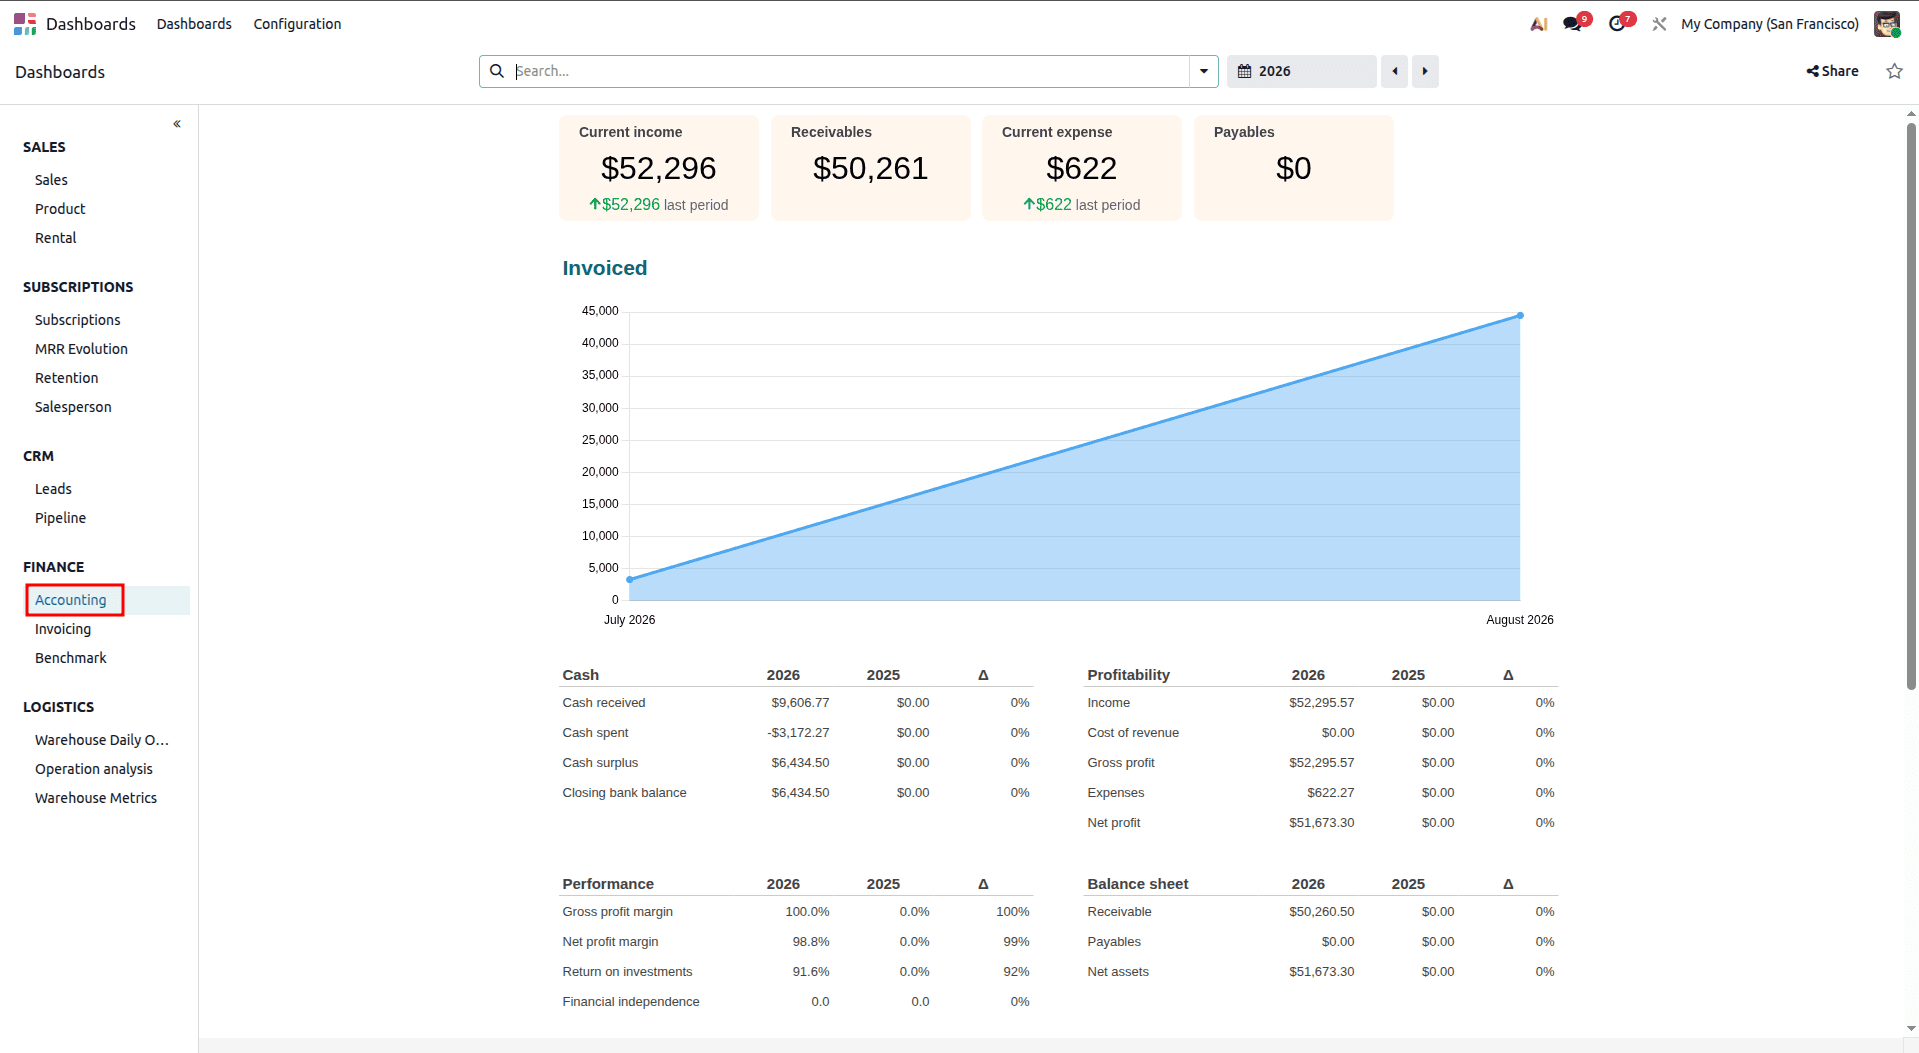
Click on the Finance category under the Dashboard, where there is an overview of the financial performance of the business. There are some important financial indicators, such as Current Income, Receivables, Current Expenses, and Payables, that are used for keeping track of the financial status of the business through the dashboard.
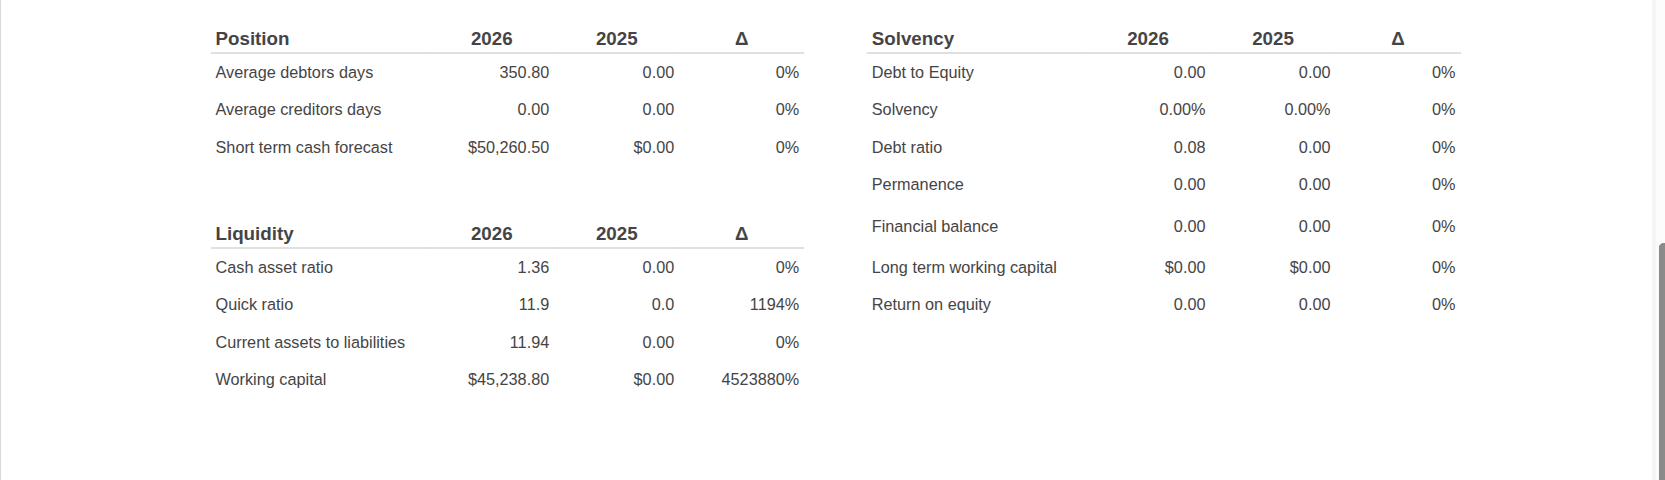
Moreover, there is a graphical analysis of monthly invoicing on the Dashboard, which can help you see income and billing patterns over the months. The Dashboard also offers financial insights like Cash, Profitability, Performance, Balance Sheet, Financial Position, Solvency, and Liquidity.
4.2 Invoicing
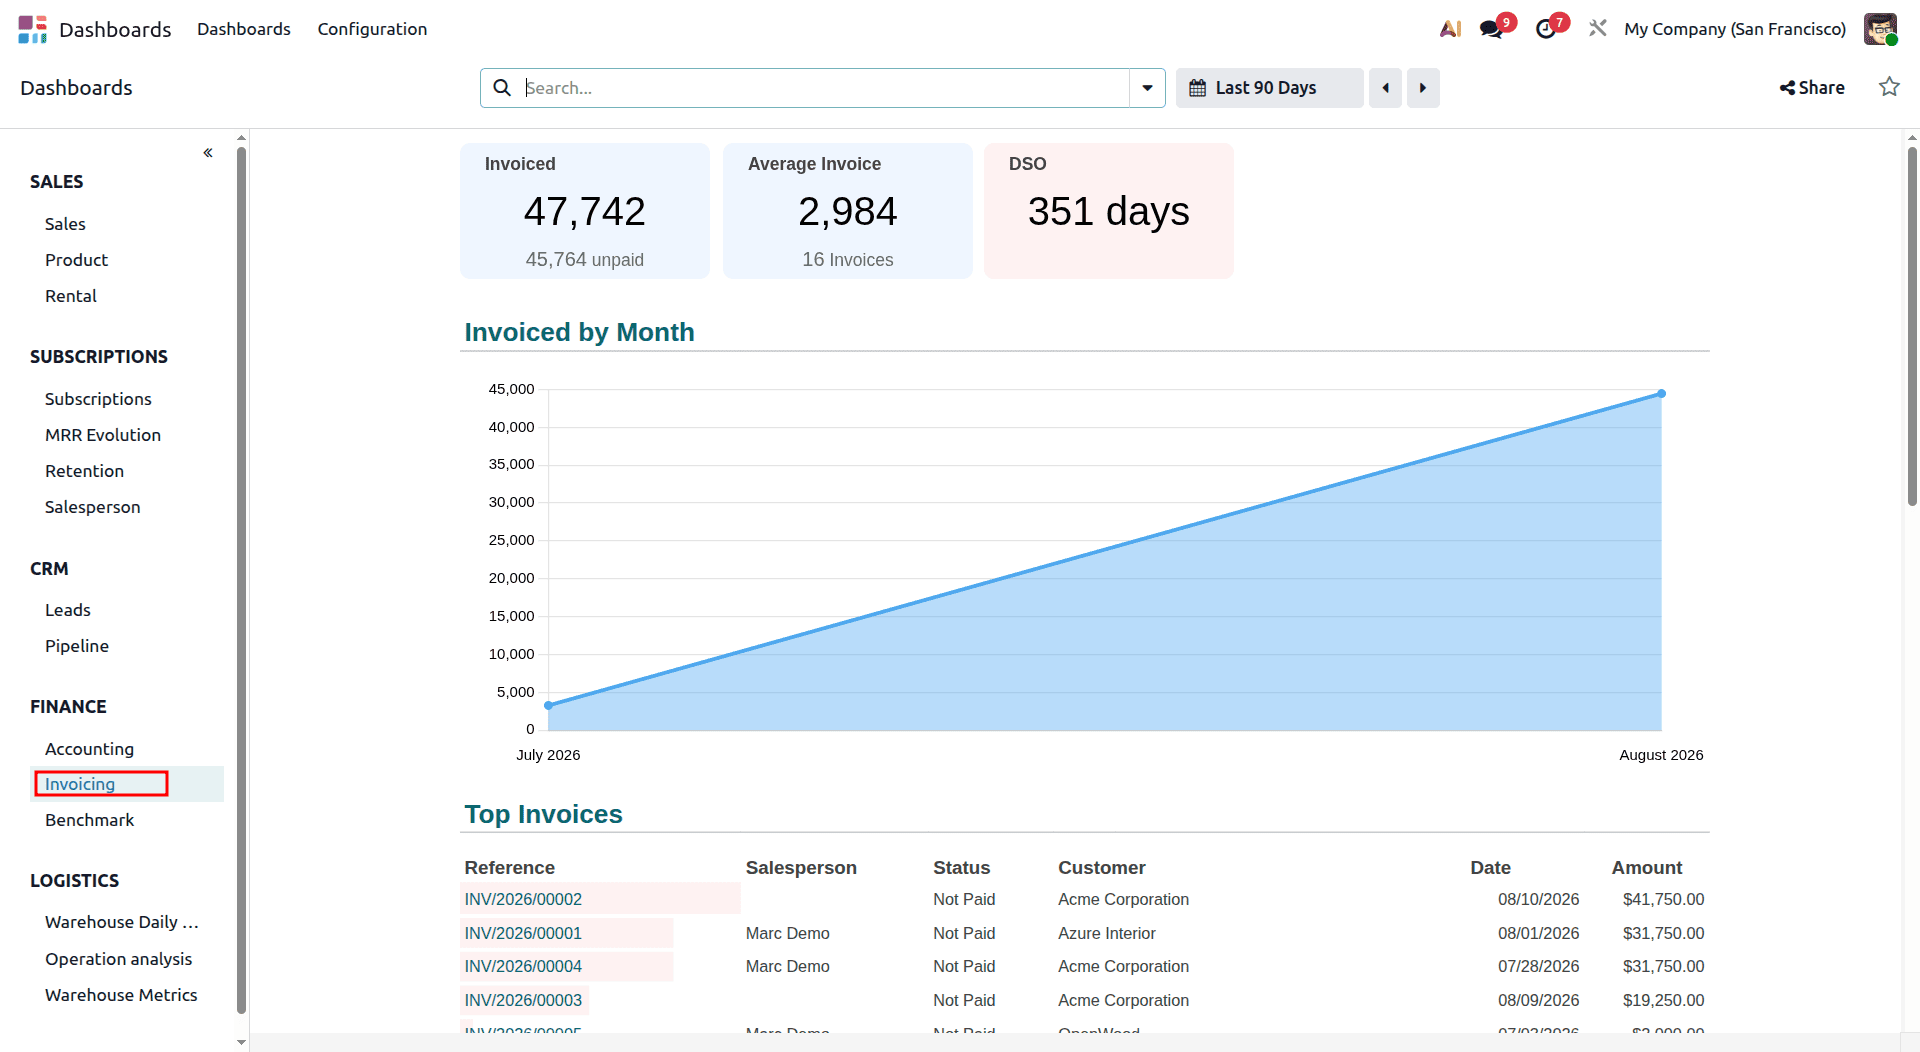
Select Invoicing from the Finance section of the Dashboard to analyze your organization's invoicing performance. This dashboard displays key metrics such as the Total Invoiced Amount, Average Invoice Amount, and Days Sales Outstanding (DSO), helping users monitor revenue generation and the efficiency of their accounts receivable process.
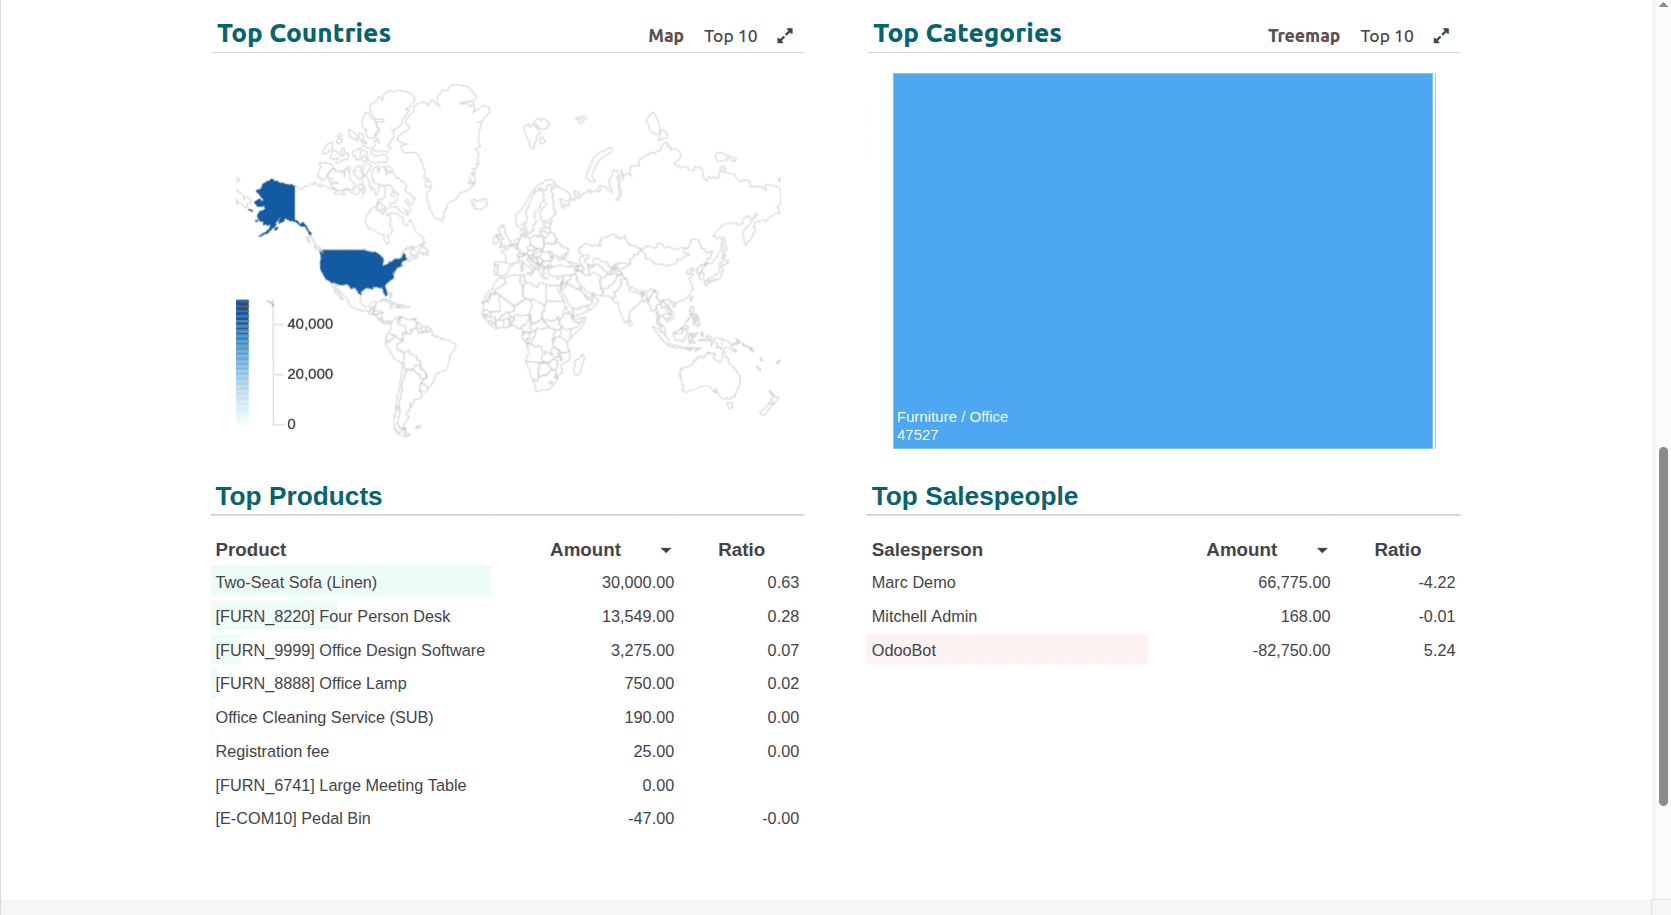
A graphical analysis of the monthly invoiced amount provides a clear view of invoicing trends over time. In addition, the Dashboard highlights detailed insights, including Top Invoices, Top Countries, Top Product Categories, Top Products, and Top Salespeople, enabling businesses to identify their highest-performing invoices, products, regions, and sales representatives.
4.3 Benchmark
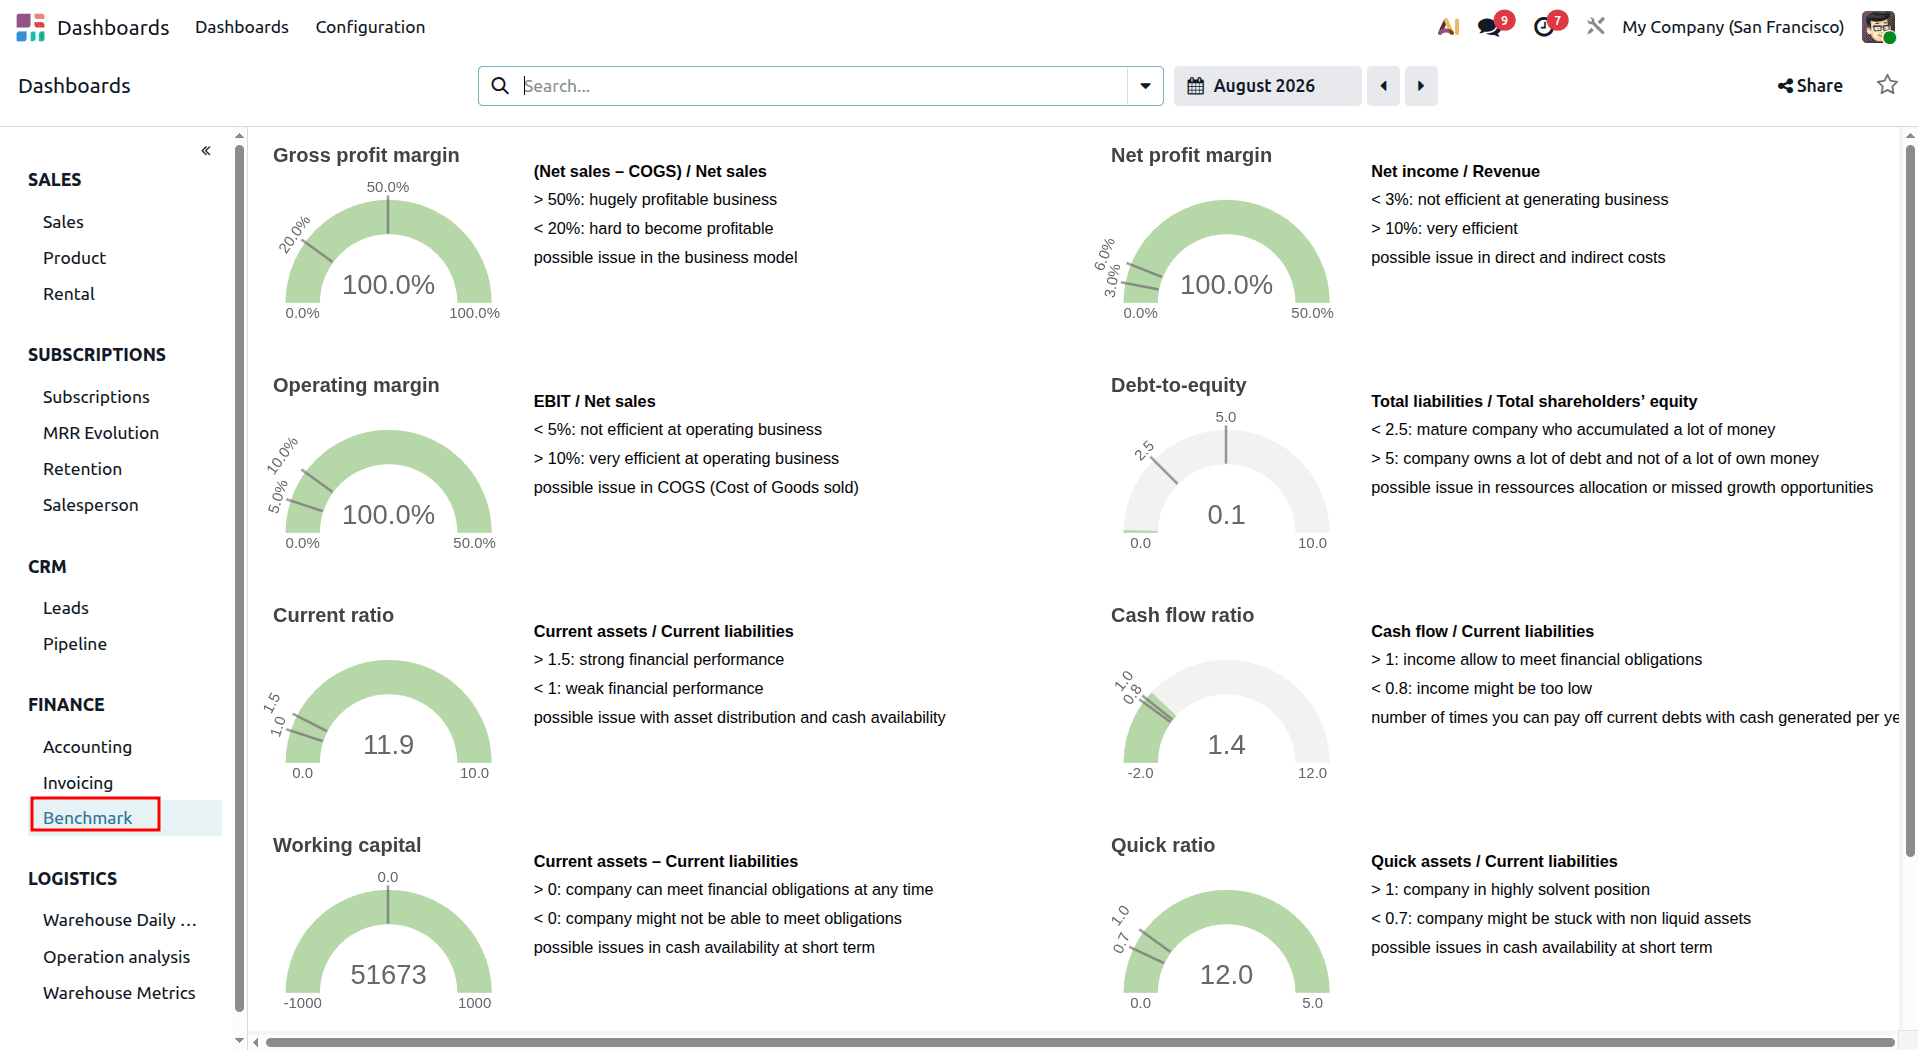
Go to Finance > Benchmark under the Dashboard to assess the performance of your firm using various profitability ratios. These dashboards offer analysis of the various financial benchmarks, such as Gross Profit Margin, Net Profit Margin, Operating Margin, among others.
This is essential for evaluating a business’s financial performance and identifying areas for improvement.
5. Logistics
5.1 Warehouse
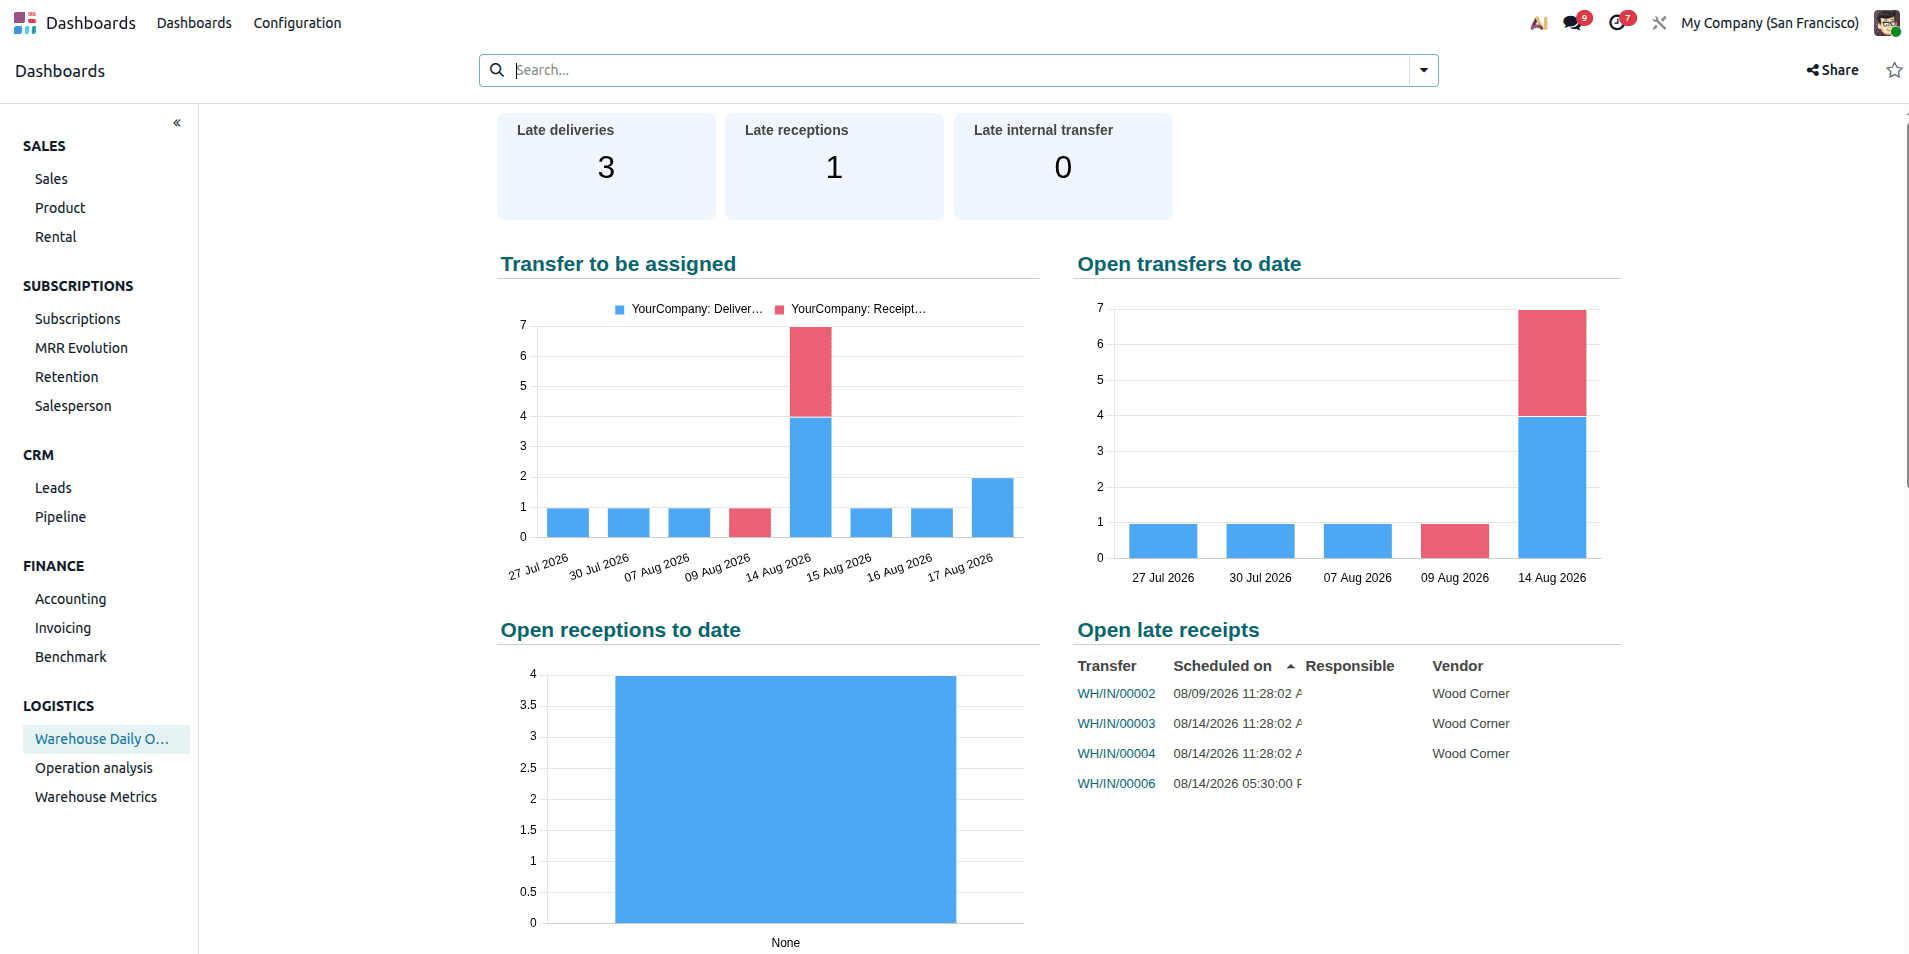
Click on Warehouse in the Logistics sub-section of the Dashboard to keep a tab on your day-to-day warehouse operations and movements of inventory. The Dashboard displays key metrics, including the number of Late Deliveries, Late Receptions, and Late Internal Transfers.
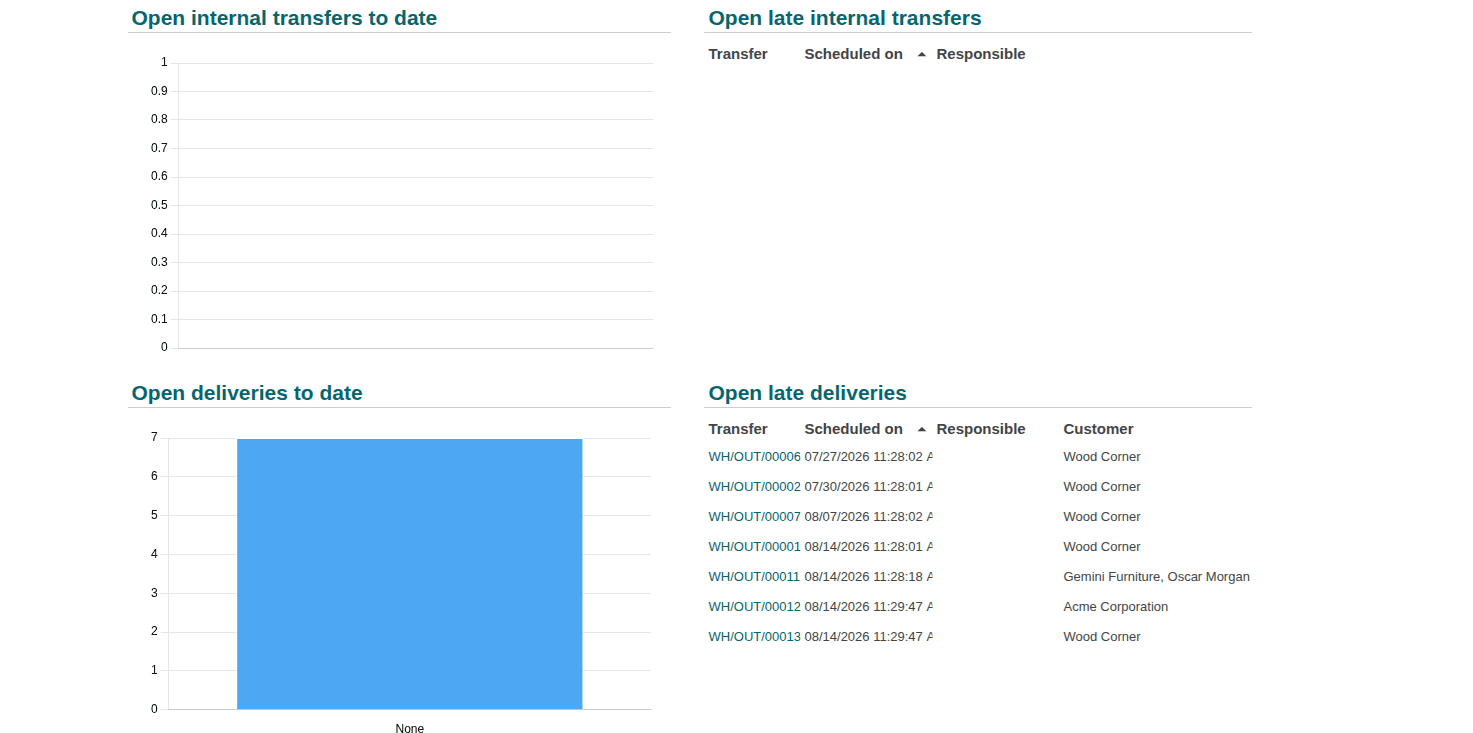
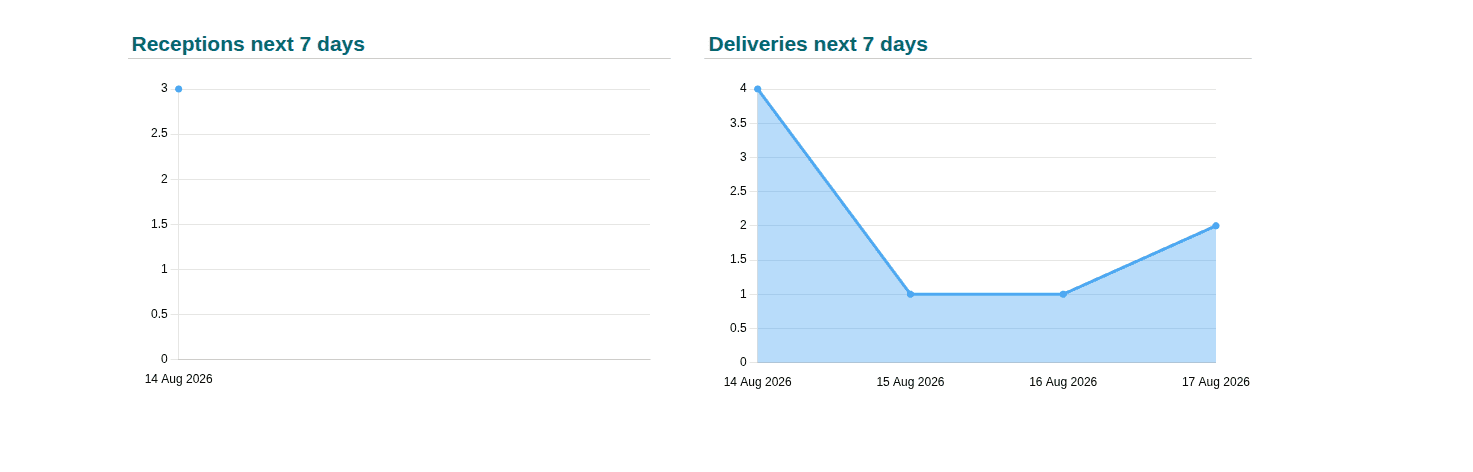
Apart from the above, the Dashboard also provides various graphical analyses of your major warehouse operations. The graphical analysis includes Transfers to Assign, Open Transfers to Date, Open Receptions to Date, Open Internal Transfers to Date, Open Deliveries to Date, Receptions in the Next 7 Days, and Deliveries for the Next 7 Days.
The Dashboard also displays key metrics for Open Late Receipts, Open Late Internal Transfers, and Open Late Deliveries.
5.2 Operational Analysis
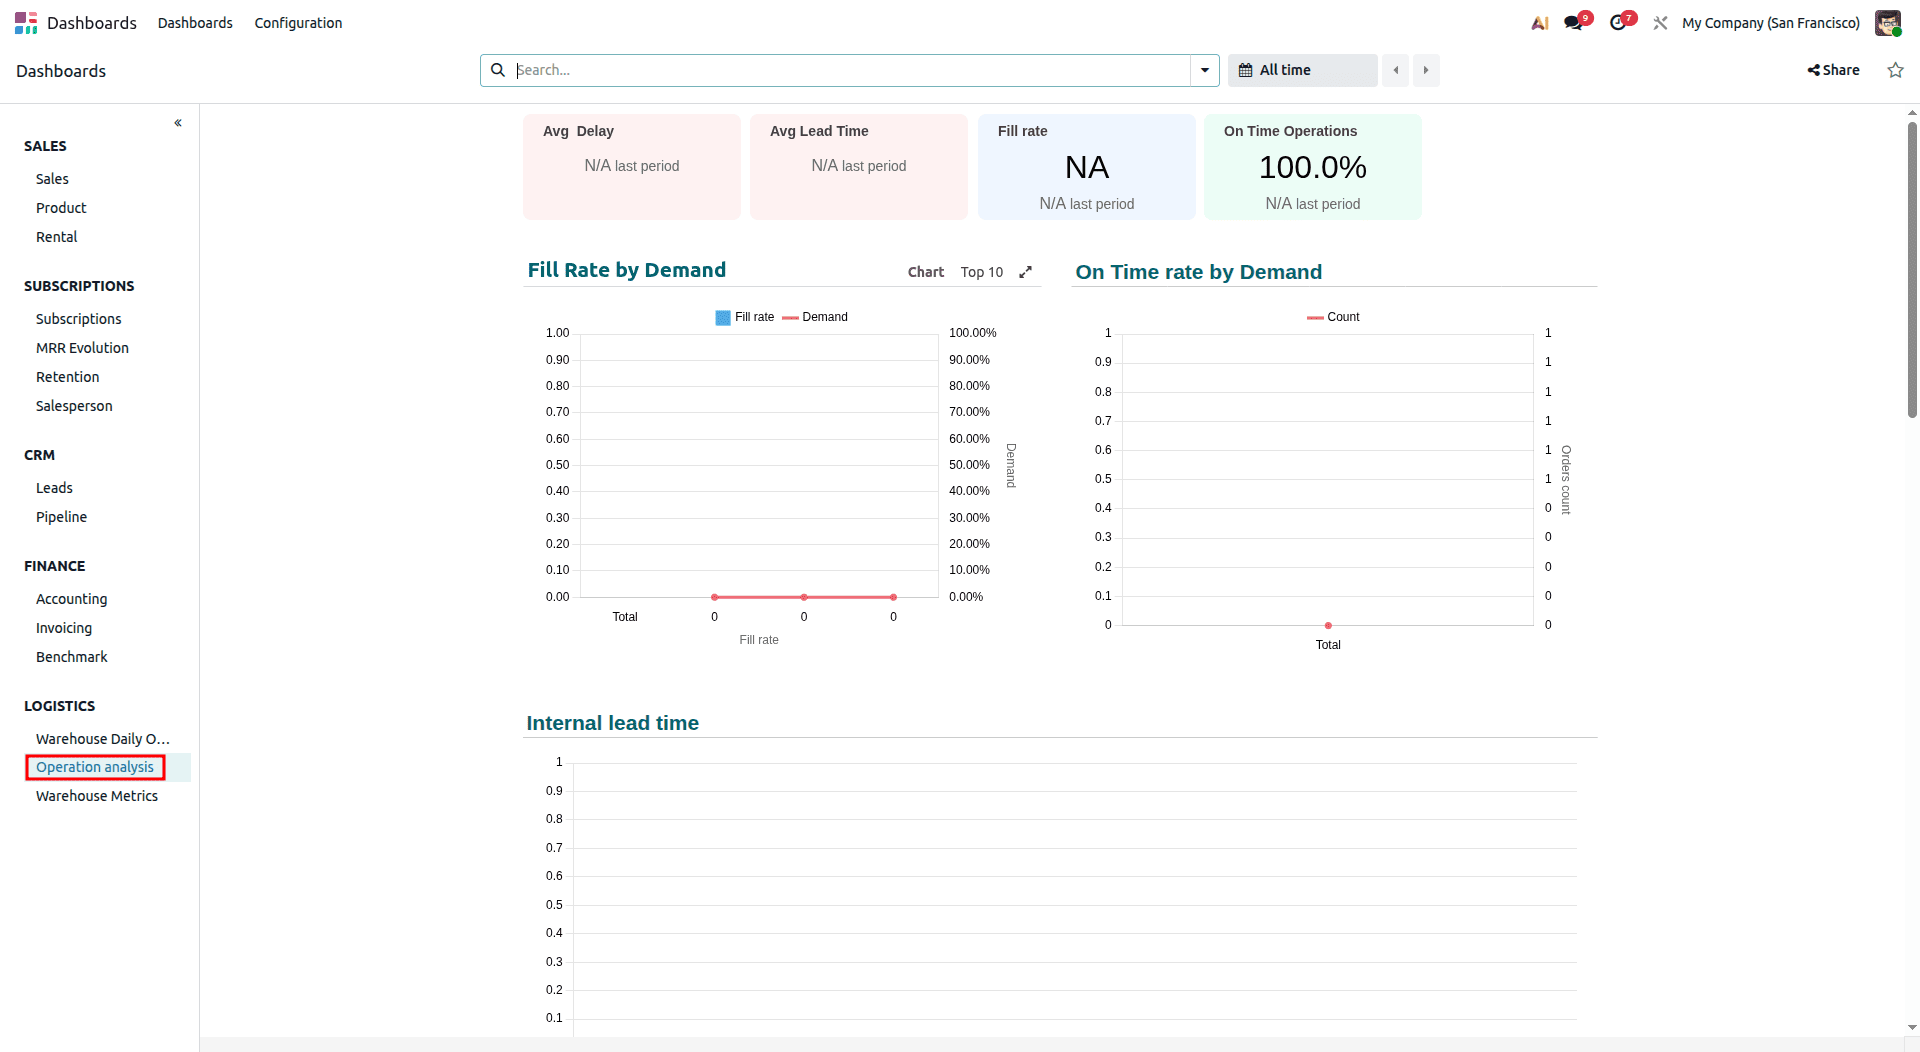
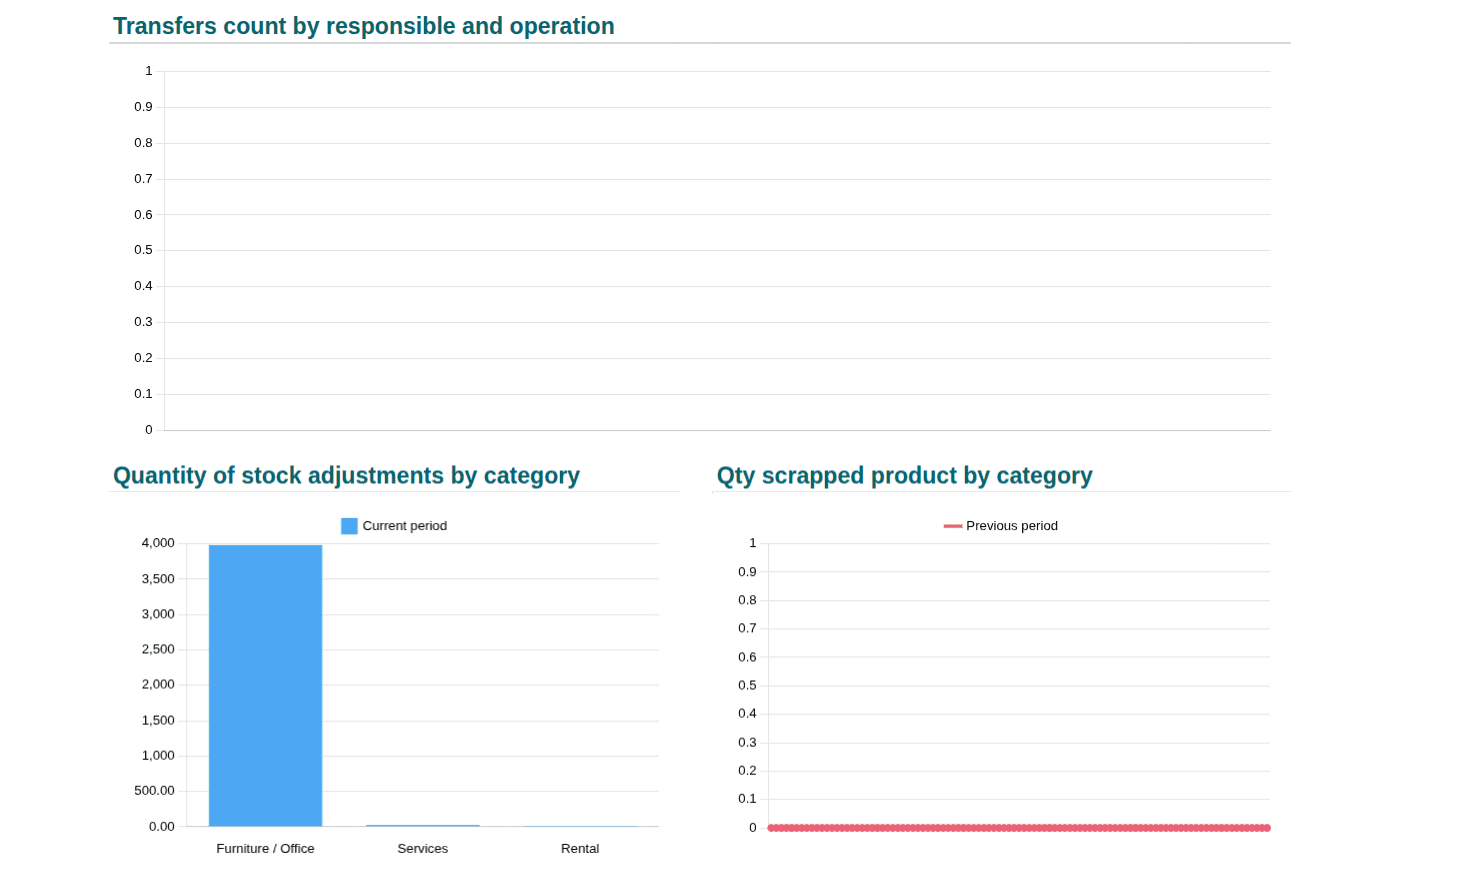
Choose Operational Analysis under Logistics to analyze the effectiveness of your warehouse and inventory operations. This dashboard consists of various KPIs, including Average Delay, Average Cycle Time, Fill Rate, and On-Time Delivery Rate, to help you gain operational insights.
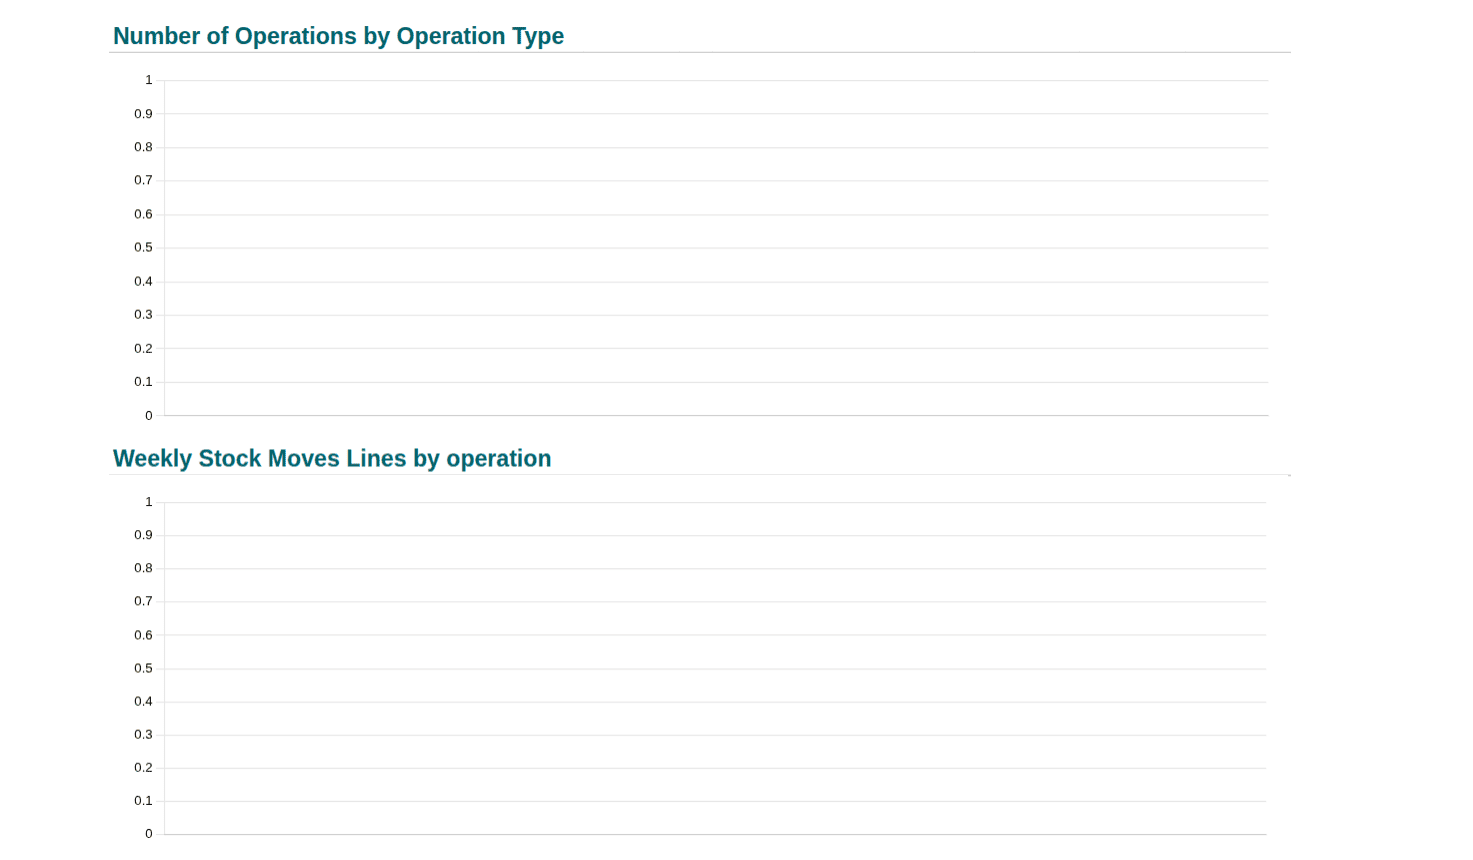
Additionally, the Dashboard provides graphical analysis of various metrics, including Fill Rate by Top Demand, On-Time Delivery Rate by Top Demand, Move Line Count by Operation, Internal Lead Time, Weekly Stock Move Lines by Operation, Transfer Count by Responsible User and Operation, Quantity of Stock Adjustments by Category, and Quantity of Scrapped Products by Category.
5.3 Warehouse Metrics
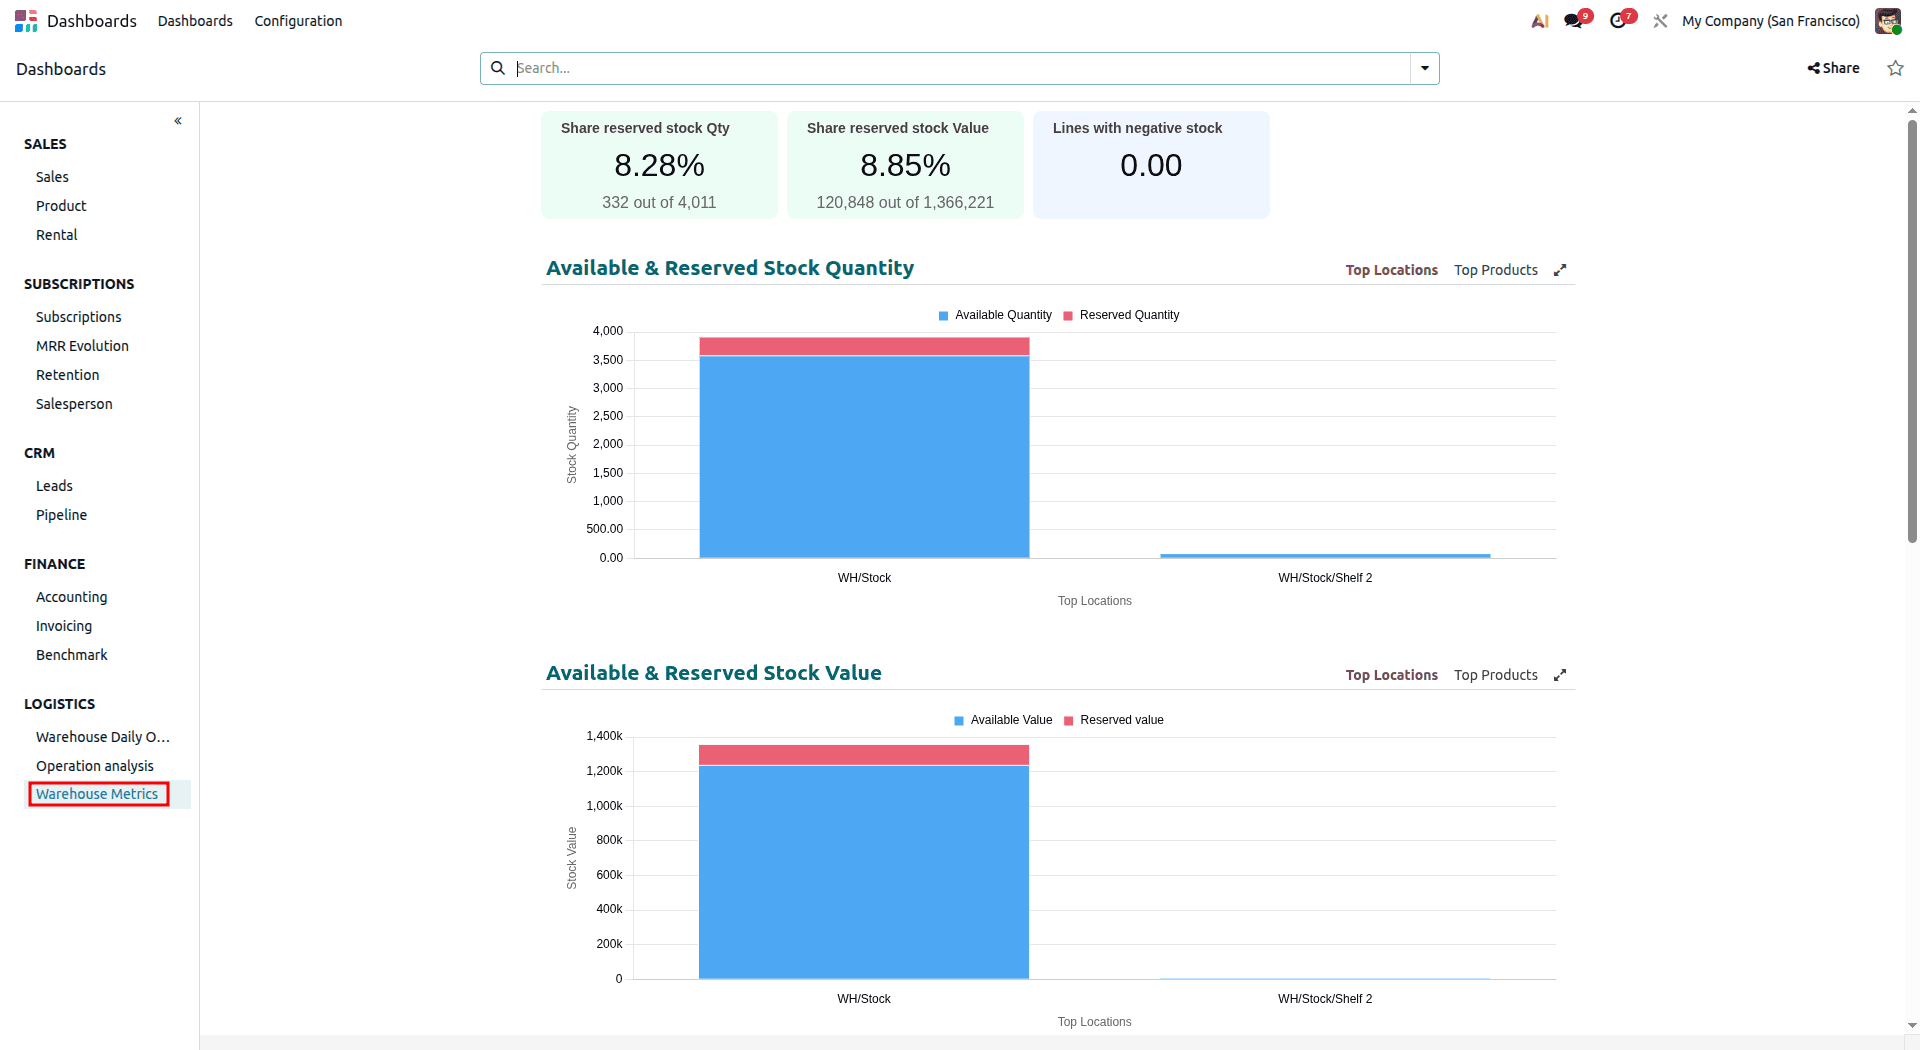
Select Warehouse Metrics from the Logistics section to gain deeper insights into warehouse inventory performance. This dashboard displays key metrics such as the Percentage of Reserved Stock Quantity, Percentage of Reserved Stock Value, and the number of Lines with Negative Stock, helping users monitor inventory availability and stock accuracy.
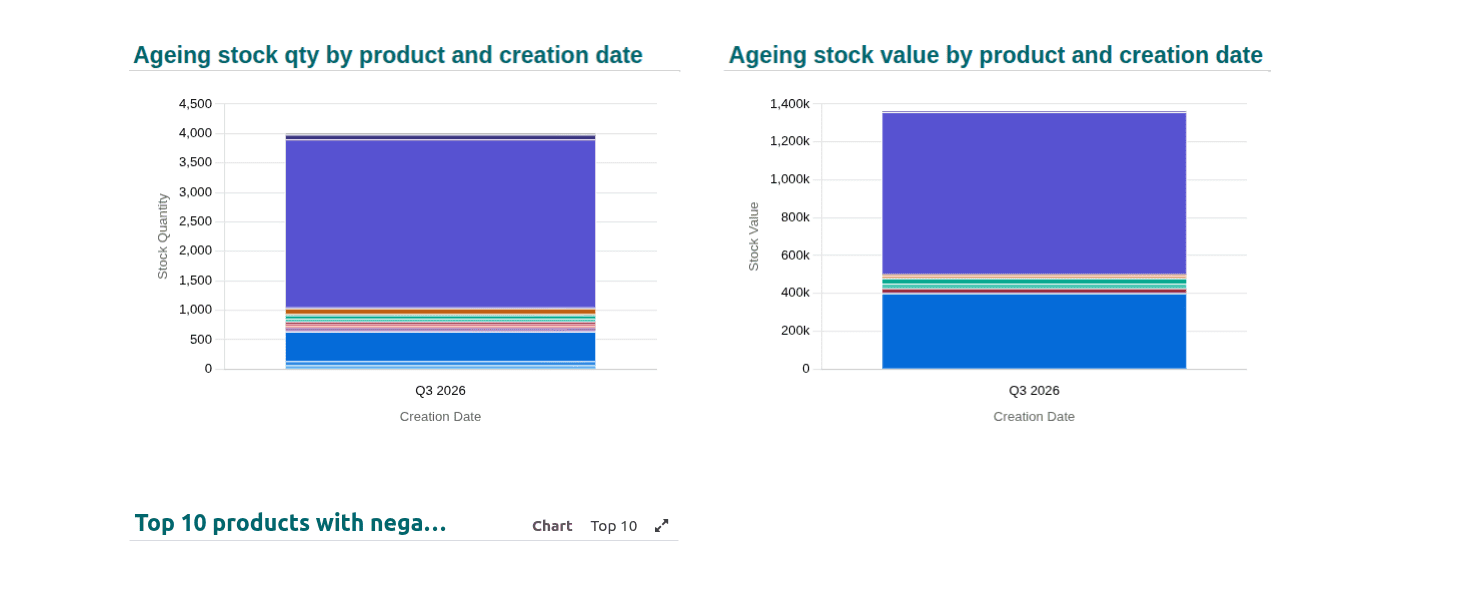
It also gives a graphical analysis of Available vs. Reserved Stock Quantity, Ageing Stock Value, Ageing Stock Quantity by Category and Creation Date, and Ageing Stock Value by Product and Creation Date. These visual reports help businesses evaluate inventory utilization, identify slow-moving stock, and optimize warehouse management.
In addition, the Dashboard lists the Top 10 Products with Negative Stock, enabling users to quickly identify inventory discrepancies and take corrective actions to maintain accurate stock levels.
5.4 Manufacturing
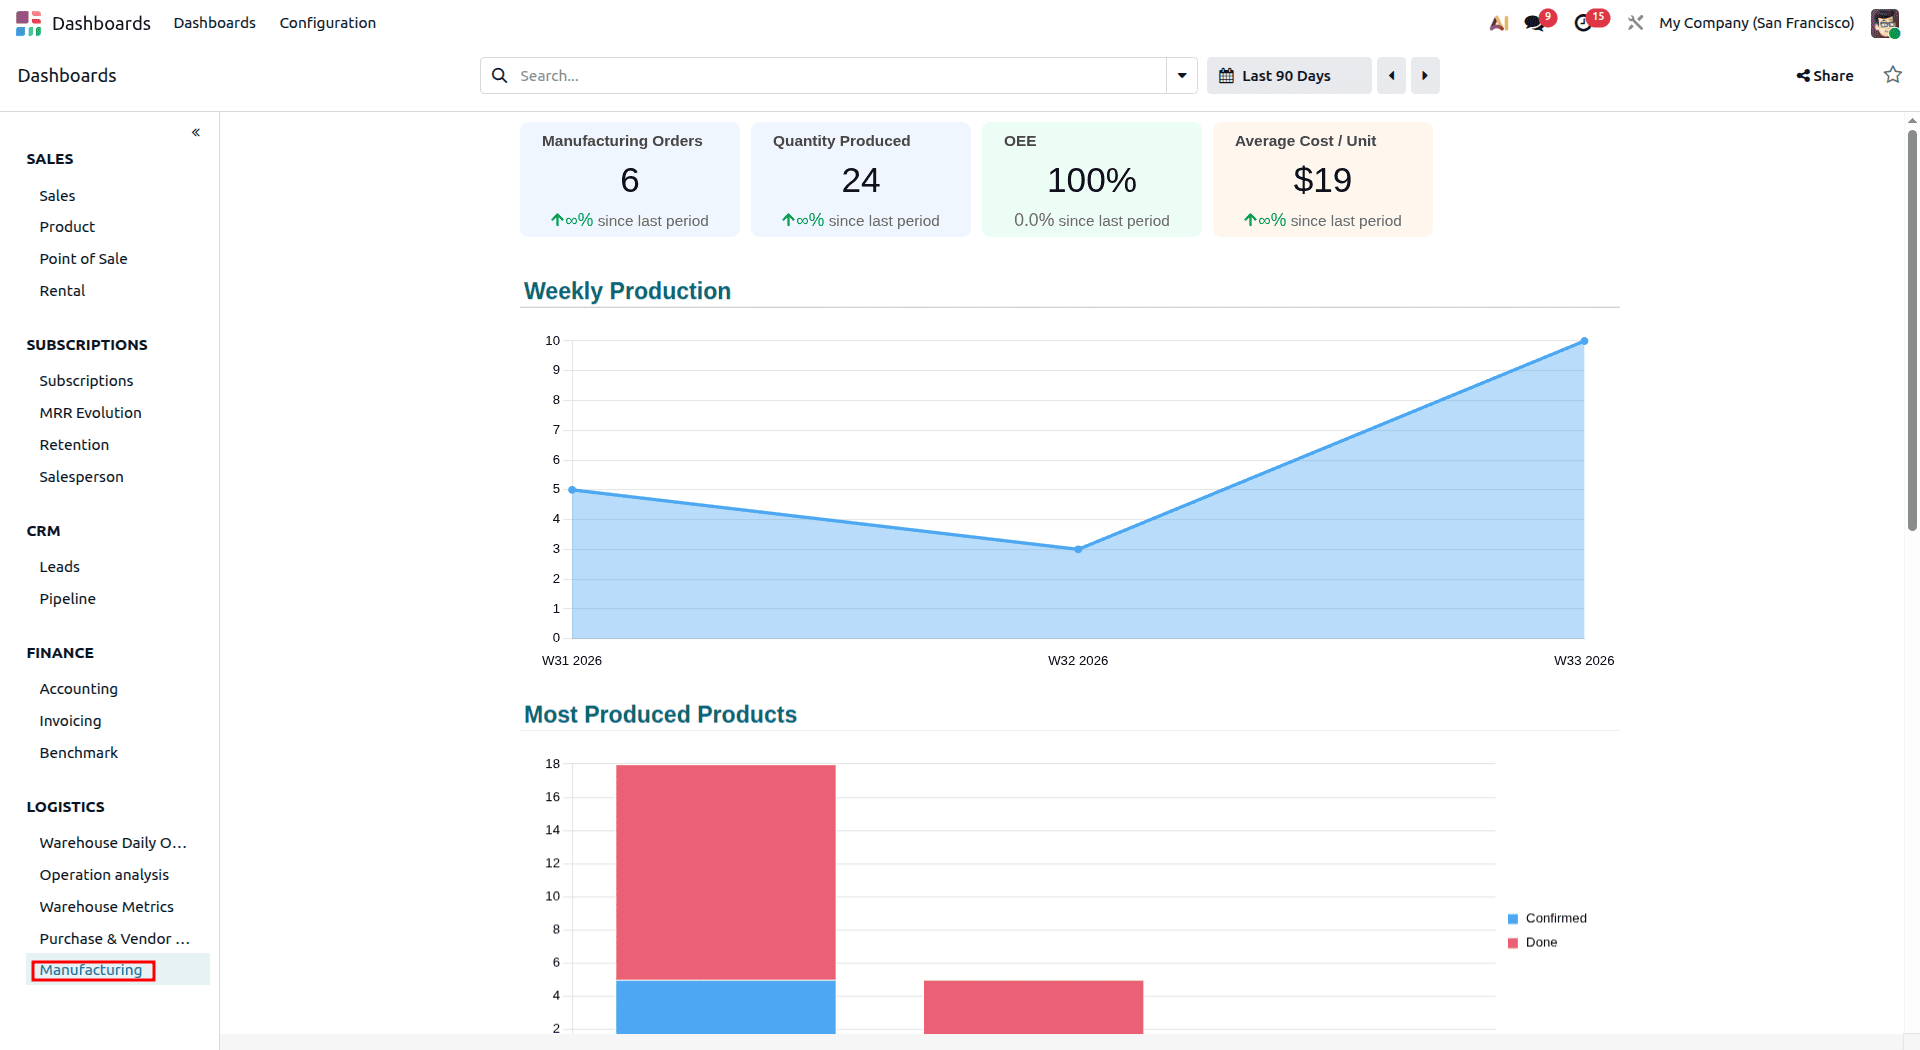
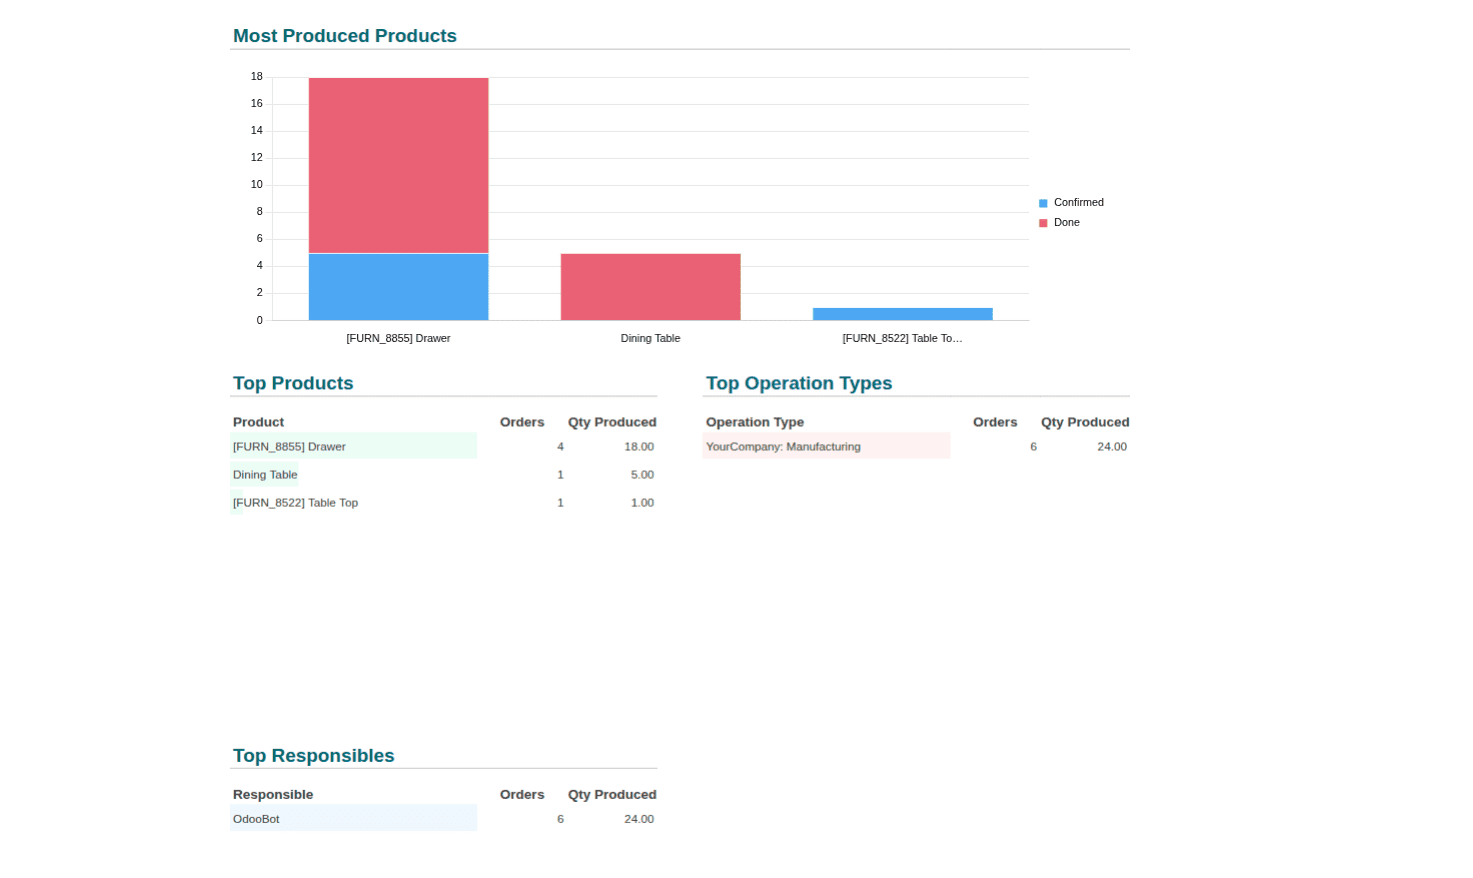
Select Manufacturing from the Logistics section of the Dashboard to monitor production performance and manufacturing efficiency. This dashboard provides key metrics such as the total number of Manufacturing Orders, Quantity Produced, Overall Equipment Effectiveness (OEE), and Average Cost per Unit, giving users a comprehensive overview of manufacturing operations.
The Dashboard also features graphical analyses of Weekly Production and Most Produced Products, enabling users to track production trends and identify the products with the highest output over time.
In addition, the Dashboard displays lists of Top Products, Top Operation Types, and Top Responsible Users, helping businesses evaluate production performance, optimize manufacturing processes, and recognize the most active production operations and personnel.
6. Website
6.1 Live Chat
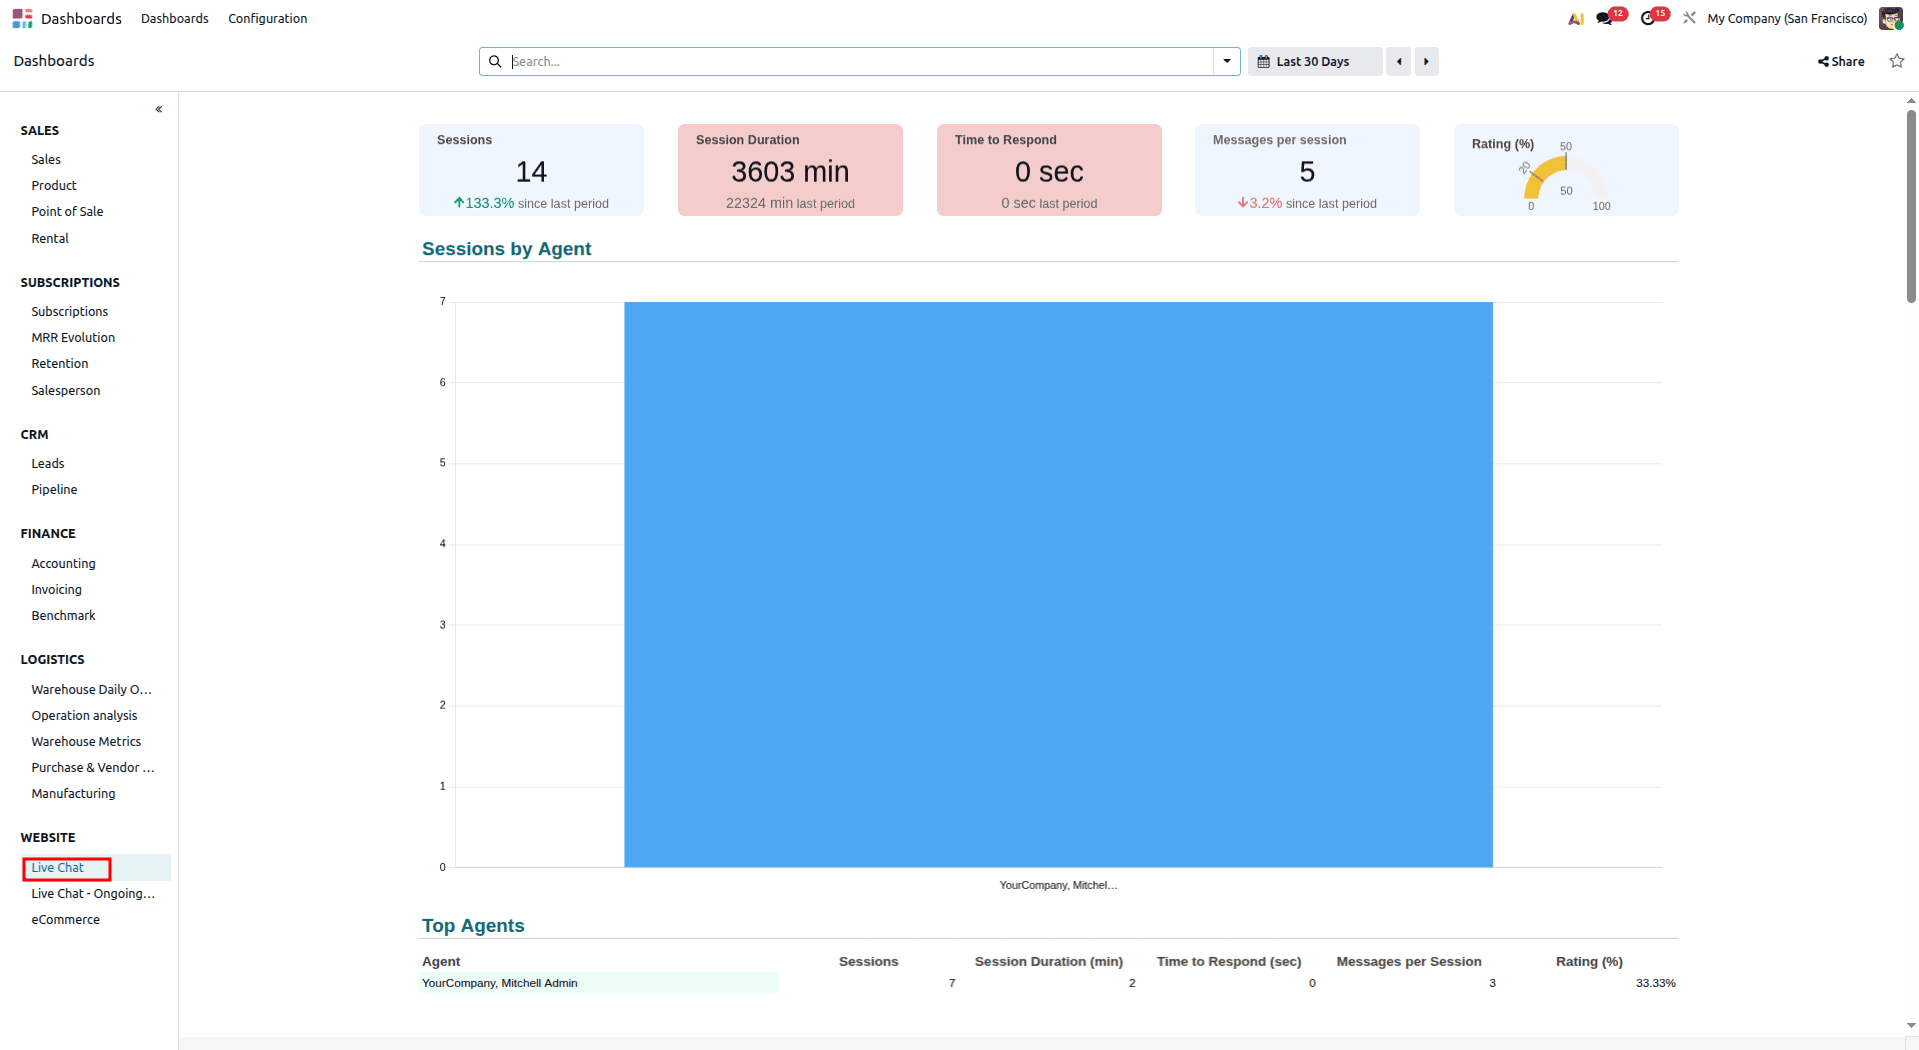
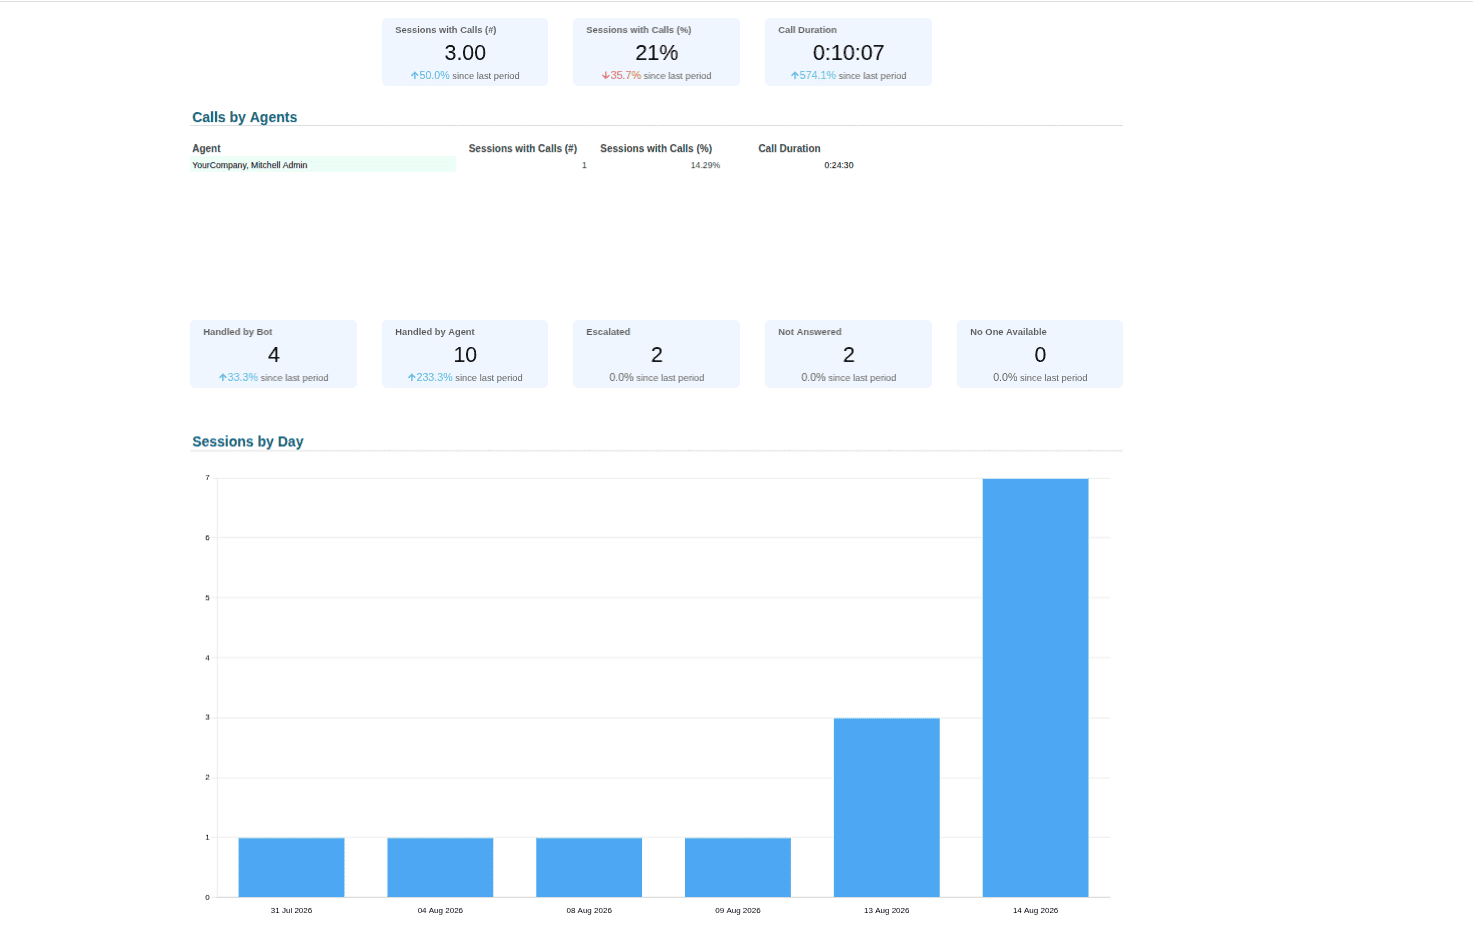
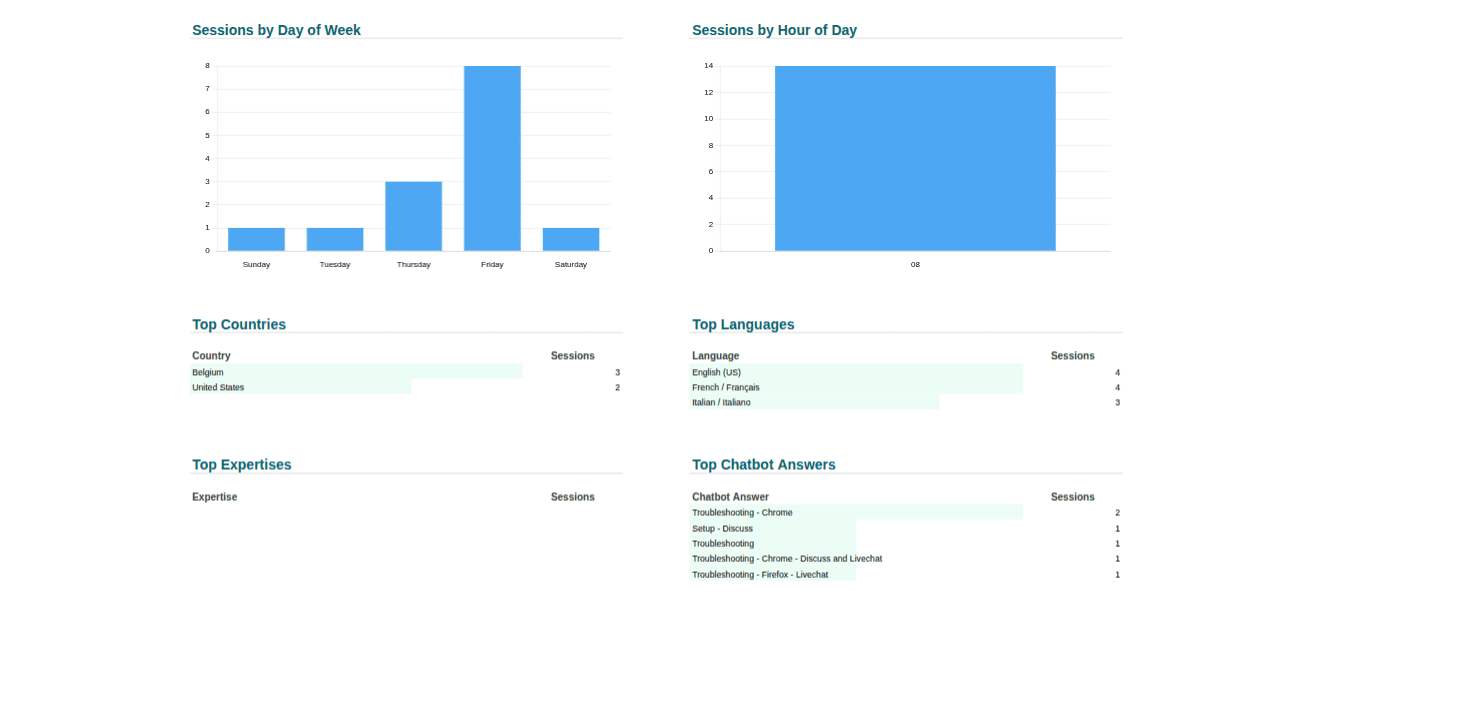
Select Live Chat from the Website section of the Dashboard to monitor customer support and live chat performance. This dashboard displays key metrics such as the total number of Chat Sessions, Average Response Time, Average Session Duration, and Average Customer Rating, enabling businesses to evaluate the efficiency and quality of their live chat service.
The Dashboard also provides graphical analyses of Daily Chat Sessions and Sessions by Operator, offering insights into chat activity and operator workload over time.
In addition, the Dashboard lists the Top Operators, allowing businesses to identify their highest-performing support agents based on live chat interactions and customer engagement.
6.2 eCommerce
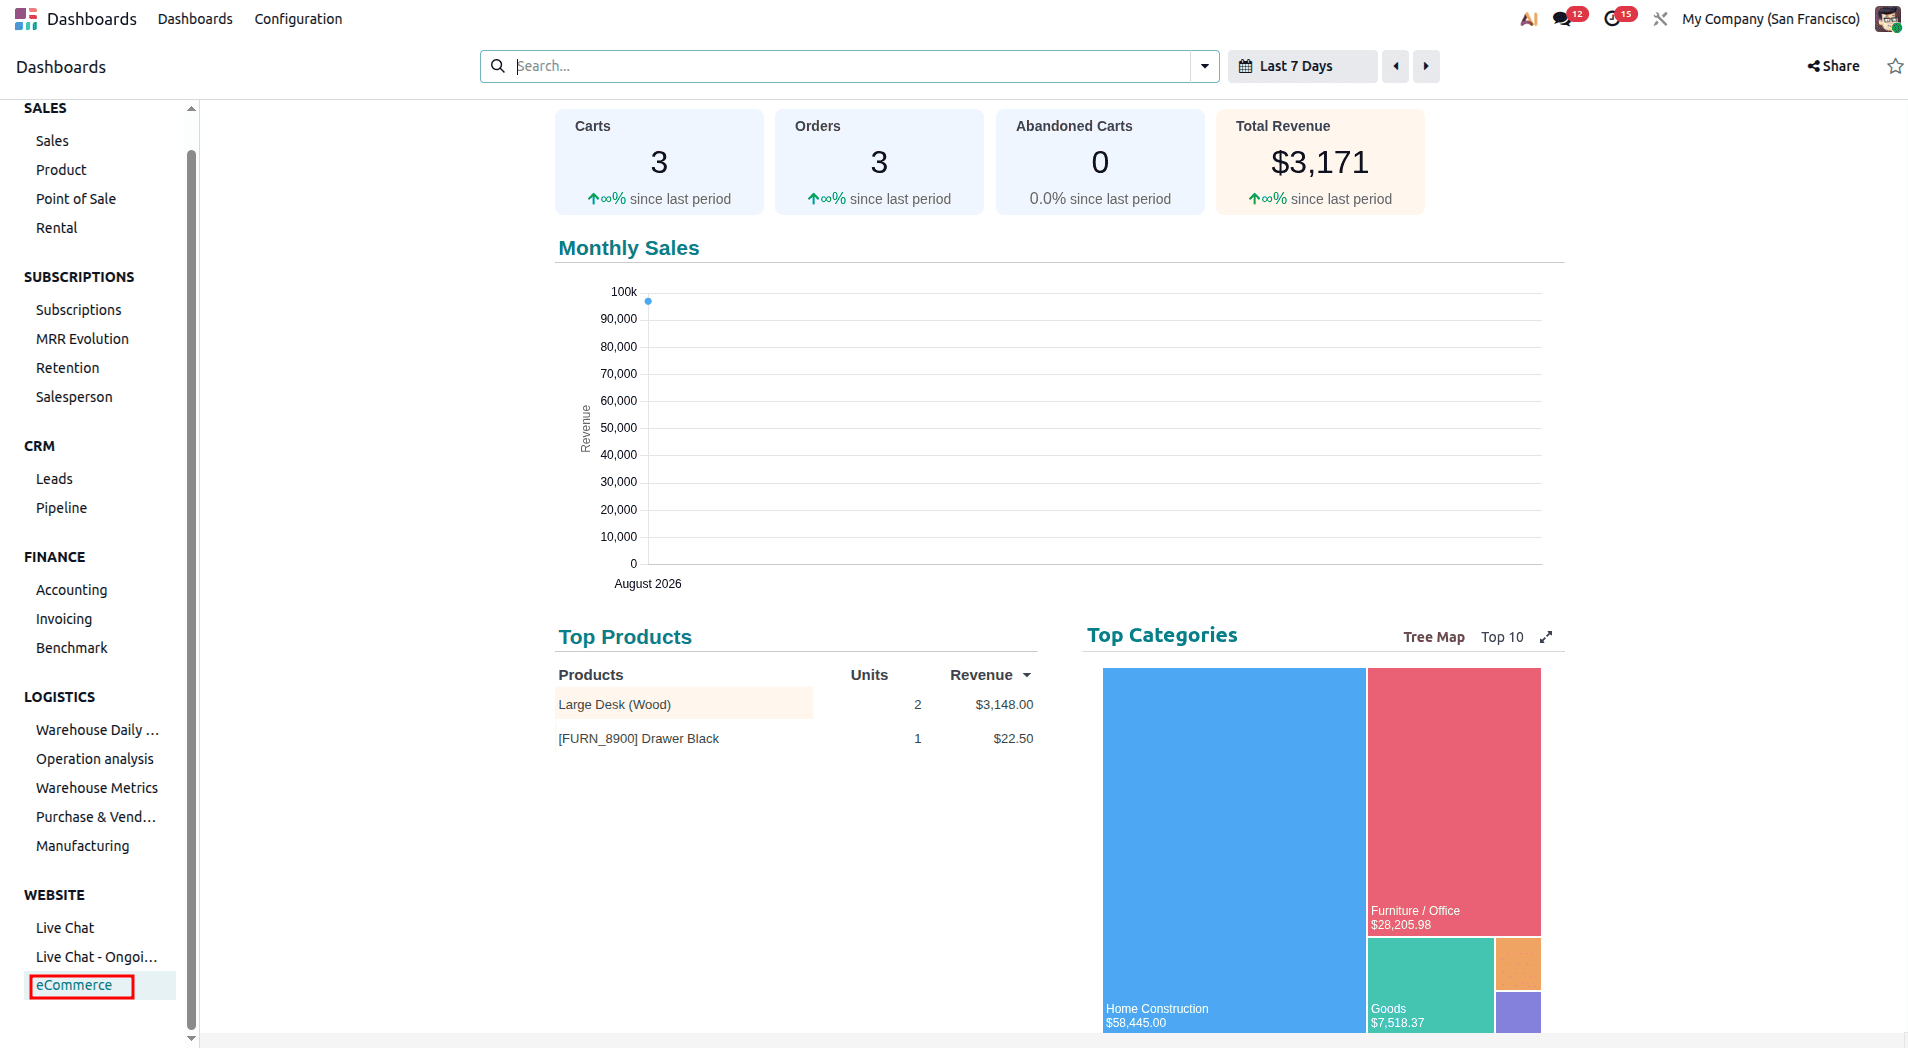
Select eCommerce from the Website section of the Dashboard to monitor your online store performance. This dashboard provides key metrics, including the total number of Shopping Carts, Orders, Abandoned Carts, and Total Revenue, giving users a comprehensive overview of their eCommerce activities.
The Dashboard also features a graphical analysis of Monthly Sales, allowing users to track sales trends and revenue growth over time. In addition, it displays lists of Top Products and Top Product Categories, making it easy to identify the best-selling products and the categories that contribute the most to overall sales.
Odoo 19 Dashboard Module is an excellent business intelligence solution that allows organizations to obtain real-time performance information regarding key performance indicators of different business units such as Sales, Subscriptions, CRM, Finance, Logistics, Manufacturing, and Website. Its interactive and customizable features, along with the ability to use different metrics, make it easy to keep track of performance and analyze trends.
Through consolidation of data obtained from different modules of Odoo in one user-friendly interface, this tool increases productivity and operational efficiency of businesses by ensuring prompt reaction to changing business circumstances. The Odoo 19 Dashboard module is essential for any business as it gives all required information on sales performance, finances, logistics, etc.
To read more about Overview of Odoo 18 Dashboard Module, refer to our blog, Overview of Odoo 18 Dashboard Module.